
Figure 3.
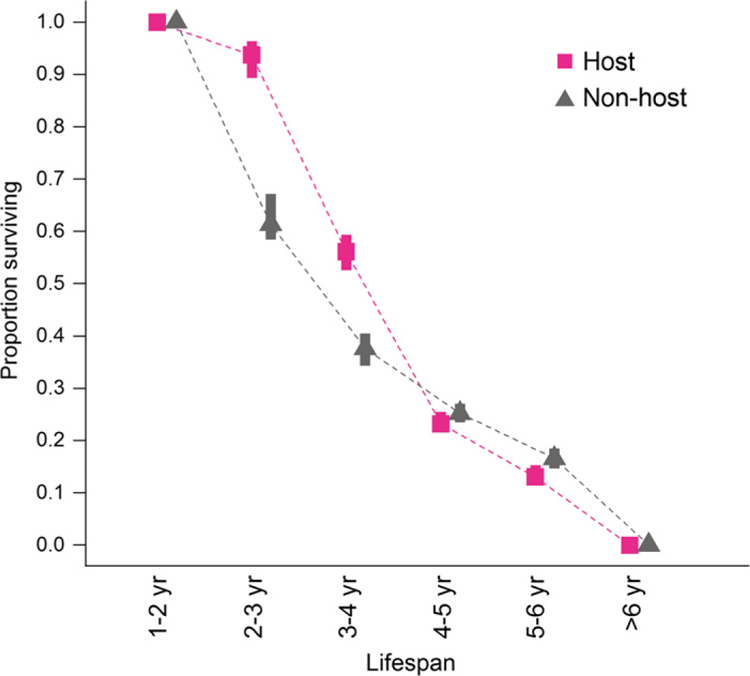
Proportion of Tasmanian devil individuals with different lifespan estimates based on their classifications into host (harbour tumours at any stage during their lifetime) and non-host (no tumours) individuals. Symbols represent the posterior mode estimates of the proportion of individuals in each class of expected lifespans (1–2, 2–3, 3–4, 4–5, 5–6, > 6 years). Vertical bars represent 95% credible intervals based on the uncertainty in individual lifespan estimates from the state-space model.