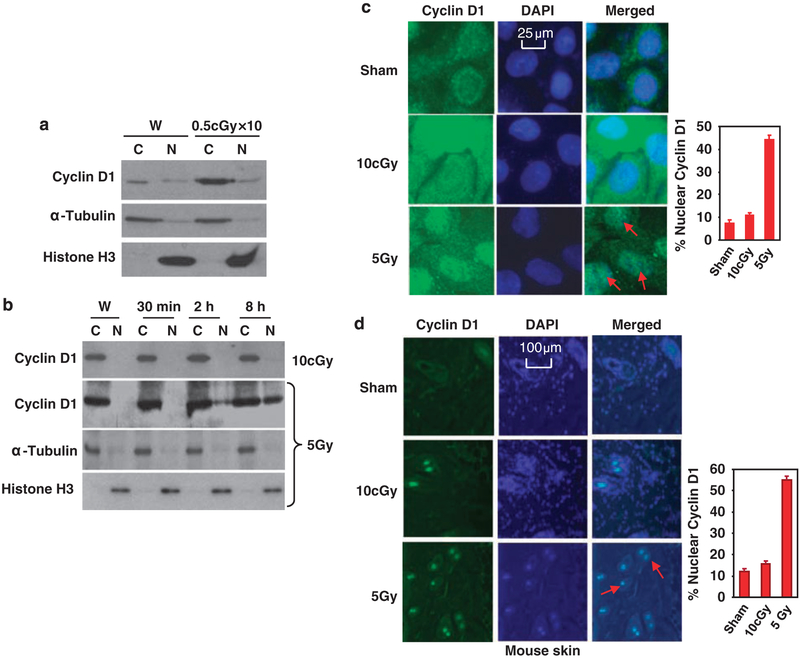
Figure 2.
Differential distribution of cyclin D1 induced by 10-cGy X-ray and 5-Gy γ-ray. (a) Cytoplasmic (C) and nuclear (N) proteins were prepared from HK18 cells at 24h after last exposure to 10 fractions of 0.5-cGy X-ray and protein levels were measured with western blotting with α-tubulin and histone H3 as cytoplasmic and nuclear markers (W, sham-LDIR (low-dose ionizing radiation) control). (b) Western blotting of cyclin D1 with cytoplasmic (C) and nuclear (N) proteins prepared at indicated time points from HK18 cells after radiation with a low- or high-dose of radiation (α-tubulin and histone H3 as markers for cytoplasmic and nuclear fractions; W, sham-LDIR control). HK18 cells were treated with sham, 10-cGy X-ray or 5-Gy γ-ray, and subjected to immunostaining of cyclin D1 and 4,6-diamidino-2-phenylindole (DAPI) staining of DNA at 8h after radiation (c). Skin tissue sections prepared from mice whole-body-irradiated with sham, 10-cGy X-ray or 5-Gy γ-ray were subjected to immunostaining (d). Right panels indicate the percentage of cells with nuclear staining of cyclin D1 (100 cells per field were counted and the average of five fields was used to generate the graph).

