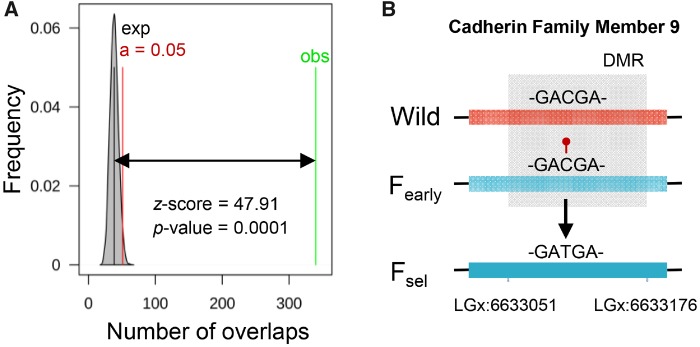
Fig. 4.
Epimutations as a consequence of the farming environment associate with genetic changes in the sea bass after 25 years of domestication. (A) DMCs in early domesticate versus wild sea bass overlap with on-the-spot SNPs in two sea bass populations after 25 years of selective breeding (Bertolini et al. 2016). The number of overlaps of the two genomic sites is shown and tested via permutations. The shaded grey area shows the number of overlaps of randomized regions with the mean represented by the black bar. The green line represents the actual number of overlaps of SNPs with DMCs and the double arrow its distance from the significance limit in red. The significance of the association is indicated by the z-score and the P value. (B) Schematic representation inside the DMR of cadherin family member 9 of a CpG in wild sea bass that was found hypermethylated (red lollipop) in early domesticates (Fearly) and converted into a TG after 25 years of selective breeding (Fsel).

