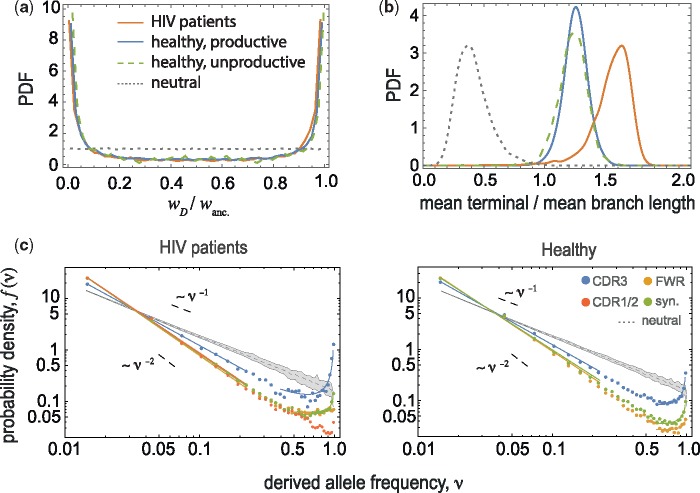
Fig. 2.
Statistics of BCR lineage genealogies indicate positive selection. (a) The U-shaped distribution of sublineage weight ratios at the root of lineage trees (see Supplementary Material online) and (b) the distribution of elongated mean terminal branch length (in units of divergence time) relative to the mean length of all branches in BCR lineages indicate positive selection in HIV patients and in healthy individuals (colors), in contrast to the neutral expectation (dotted lines); see supplementary figure S2, Supplementary Material online, for comparison of tree statistics under different evolutionary scenarios. (c) The site frequency spectrum (SFS) is shown for mutations in different regions of BCRs (distinct colors) in HIV patients (left) and in healthy individuals (right); see supplementary figure S3, Supplementary Material online, for SFS of unproductive BCR lineages. The frequencies are estimated within each lineage and the distributions are aggregates across lineages of size >100, amounting to a total of 1,524 lineages in HIV patients and 2,795 lineages in healthy individuals; see supplementary table S1, Supplementary Material online for details. The gray area shows the span of SFS across 100 realizations of simulated neutral trees (Kingman’s coalescent) with sizes equal to the BCR lineages in HIV patients (left) and in healthy individuals (right). The significant upturn of the SFS for nonsynonymous mutations in the CDR3 region is indicative of rapid evolution under positive selection. The upturn for synonymous mutations indicates hitchhiking of neutral mutations along with the positively selected alleles (see Supplementary Material online).

