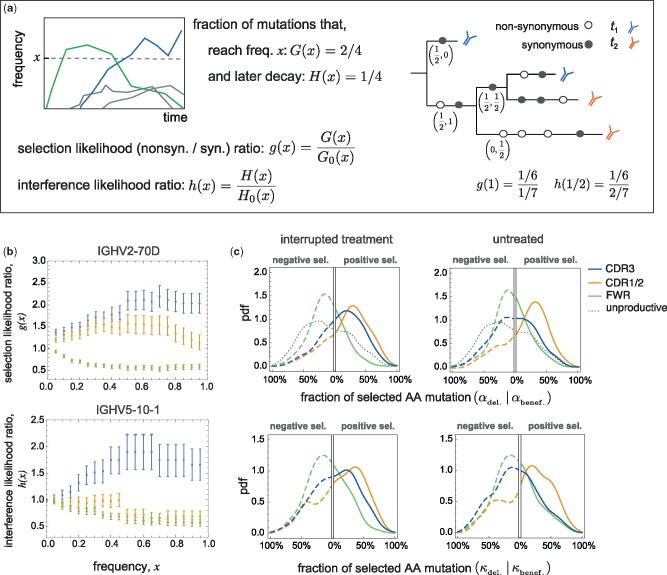
Fig. 3.
Inference of selection and clonal interference in BCR lineages. (a) Schematic shows time-dependent frequencies of four distinct mutations that rise within a population (left). We denote the fraction of mutations that reach frequency x (at any time point) within a population (or lineage) by G(x) (blue and green) and the subset that later goes extinct due to clonal interference by H(x) (green). Classifying the mutations into nonsynonymous and synonymous groups, we quantify the strength of selection using the likelihood ratios between the nonsynonymous and synonymous mutations, . A schematic B-cell genealogy (right) is shown for a lineage sampled at two time points (colors). Nonsynonymous and synonymous mutations are shown by empty and filled circles and their time-dependent frequencies , as observed in the sampled tree leaves, are indicated below a number of branches. The corresponding likelihood ratios are given below. (b) Selection likelihood ratio g(x) in the V-gene class IGHV2-70D (top; pooled from 35 lineages) and the interference likelihood ratio h(x) for the V-gene class IGHV5-10-1(bottom; pooled from 18 lineages) in patient 5 are plotted against frequency x for mutations in different BCR regions (colors). The likelihood ratios indicate positive selection and strong clonal interference in the CDR3 region, negative selection on the FWR region and positive selection on mutations that rise to intermediate frequencies in the joint CDR1/CDR2 regions. We do not observe interference in the FWR and the joint CDR1/CDR2 regions. The error bars are estimated assuming a binomial sampling of the mutations (see Supplementary Material online). (c) Each panel shows the probability density across distinct VJ-gene classes in HIV patients with interrupted treatment (left) and without treatment (right), of the fractions of beneficial and deleterious mutations and on the right x-axis and the left inverted x-axis, respectively, that reach frequency within a lineage (top), and similarly, the fractions of beneficial and deleterious mutations ( and ) that reach frequency within a lineage and later go extinct (bottom). The fraction of selected mutations are estimated based on the deviation of the likelihood ratios, g(x) and h(x), from 1 in VJ-gene classes within each patient separately (see Materials and Methods and Supplementary Material online). These aggregate statistics are then pooled together to form the histograms, without averaging over VJ-genes across patients. The dotted gray line indicates the null distribution from unproductive lineages of healthy individuals (supplementary fig. S8, Supplementary Material online). The probability densities are evaluated from 13,601 lineages and aggregated over 661 VJ-gene classes pooled from the four patients with interrupted treatment (left), from 7,043 lineages with 373 VJ-gene classes pooled from the two untreated patients (right) and from 2,903 unproductive lineages with 417 VJ-gene classes pooled from three healthy individuals (dotted gray). The color code for distinct BCR regions in all panels is consistent with the legend; see Supplementary Material online for statistical details, supplementary table S1, Supplementary Material online, for details on lineages and figure 4 and supplementary figs. S5, S6, S8, and S10, Supplementary Material online, for further analysis of likelihood ratios and selection statistics.

