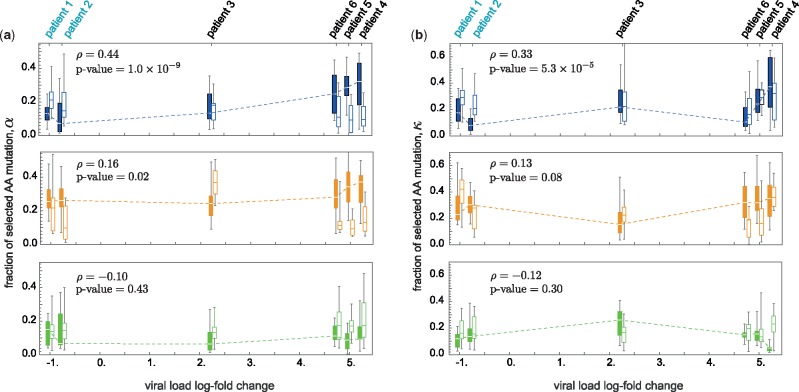
Fig. 4.
Fraction of beneficial and deleterious mutations in BCRs of all patients. (a) The box plots show the distributions across V-gene classes for the fraction of beneficial (filled boxes) and deleterious (empty boxes) mutations that reach frequency within a lineage in each BCR region: CDR3 (top, blue), CDR1/2 (middle, orange), and FWR (bottom, green); midline: median; box: 40% around median; bars: 80% around median. (b) shows similar statistics for the fraction of beneficial and deleterious mutations () that reach frequency within a lineage and later go extinct, measuring the extent of clonal interference in B-cells. The patients are positioned along the x-axis in accordance to their viral load change over the course of infection, estimated as the difference of the averaged log-viral load between the second year () and the first year () of the study, ; see supplementary table S2, Supplementary Material online. Patients 1–2 are ART-naive and the rest had interrupted their treatments after week 48. The dashed line in each figure traces the median for the distribution of the beneficial mutations (filled boxes) as a function of the change in viral load. In the CDR3 region, positive selection and clonal interference among beneficial mutations are significantly stronger in patients with a larger change in viral load, with Spearman rank correlation and significance indicated in the corresponding panels. The correlations in other regions are small and insignificant with . Estimated correlations for the fraction of negatively selected mutations are small and insignificant (the values are not shown). Correlations are estimated from the whole data and not only the median of the distributions, indicated by the dashed lines.

