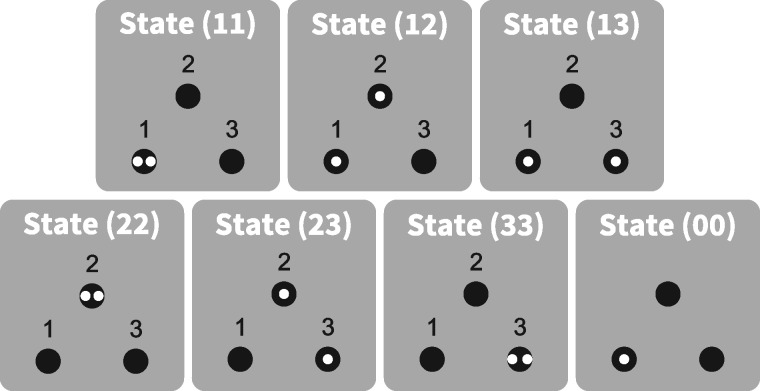
Fig. 2.
Schematic representation of all states for two lineages in a population divided into K = 3 distinguishable subpopulations. Lineages appear in white, and subpopulations appear in black. The two lineages can either be in different subpopulations (states (12), (13), and (23)), in the same subpopulation ((11), (22), and (33)), or they can already have coalesced ((00)).

