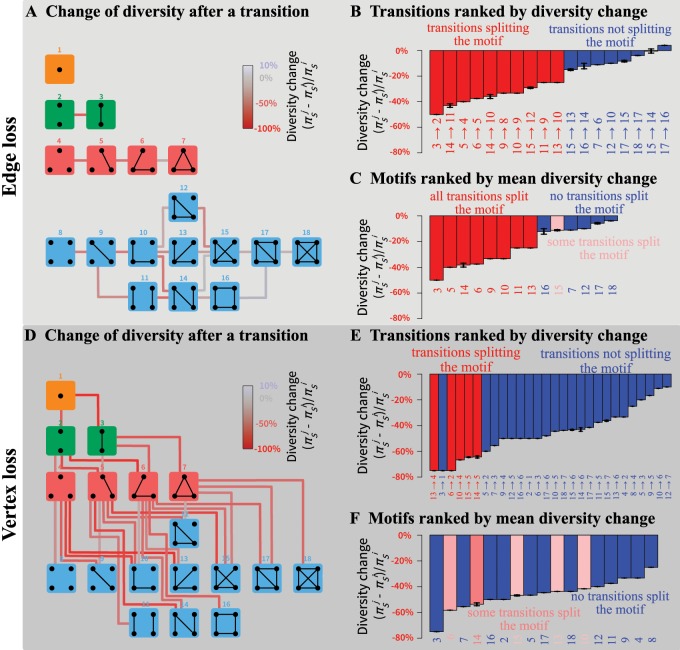
Fig. 4.
Change of within-subpopulation nucleotide diversity following a transition from motif i to motif j, for all transitions involving the loss of a single edge or a single vertex. (A) Schematic representation of all motif transitions involving an edge loss. (B) Motif transitions involving an edge loss ranked by value. (C) Motifs ranked from largest to smallest diversity loss following edge loss. For each motif, the mean loss or gain is computed across all possible transitions to another motif. For example, for motif 5, three subpopulations can be lost; loss of the isolated subpopulation produces motif 3, leading to , and loss of one of the two other subpopulations produces motif 2 and . The mean diversity loss for motif 5 is thus . (D) Schematic representation of all motif transitions involving a vertex loss; note that in the case of vertex loss, we consider that the lost subpopulation has diversity 0 (see example in the Enumerating Outcomes of Disturbance Events section). (E) Motif transitions involving a vertex loss ranked by value. (F) Motifs ranked from largest to smallest mean diversity loss following vertex loss. In (A) and (D), lines connecting motifs represent transitions and are colored by value. In all panels, values assume M = 1; in (B), (C), (E), and (F), black horizontal bars represent minimum and maximum values for M in . Values of and are computed from equation (4); minima and maxima of are obtained numerically.

