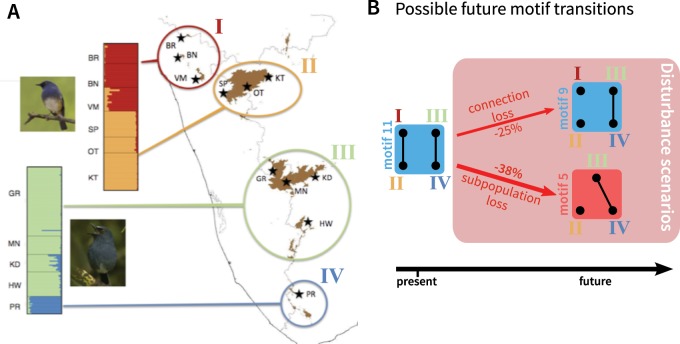
Fig. 5.
Application of the network theory framework to the Indian sky island birds Sholicola albiventris, S. major, and S. ashambuensis. (A) Map of the distribution of S. albiventris, S. major, and S. ashambuensis in the Indian sky islands of the Western Ghats with sampling locations, and STRUCTURE plot. The map and the STRUCTURE plot are adapted from Robin et al. (2015) and informed by Robin et al. (2017). Colors and roman numerals represent the four genetic clusters. Two-letter codes indicate the sampling locations. Sampling locations for S. major include BR, Brahmagiri; BN, Banasura; VM, Vellarimala; SP, Sispara; OT, Ooty; and KT, Kothagiri. Sampling locations for S. albiventris include GR, Grasshills; MN, Munnar; KD, Kodaik-anal; and HW, High Wavys. Sampling locations for S. ashambuensis include PR, Peppara. (B) Possible future motif transitions, based on the transitions from motif 11, which is taken to represent the current state of the population. Numbers on arrows represent predicted losses of mean nucleotide diversity across subpopulations (fig. 4).

