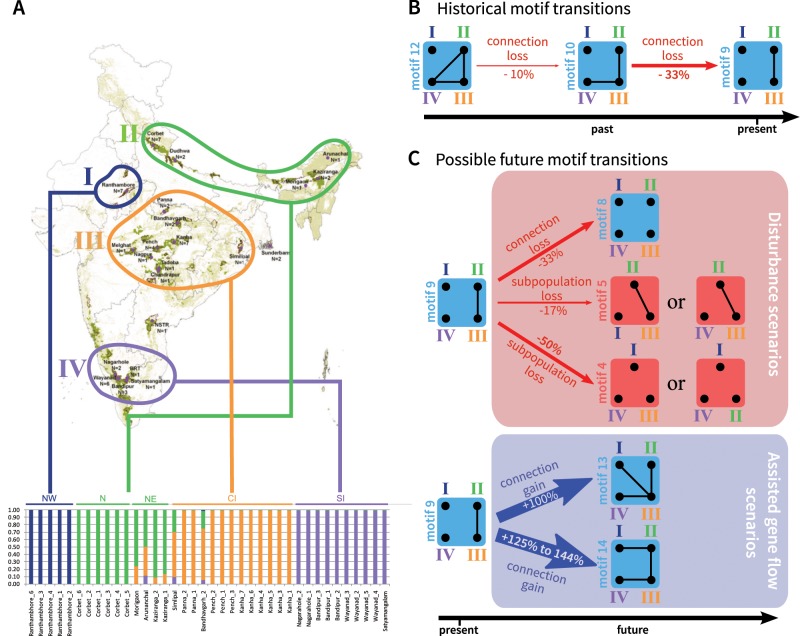
Fig. 6.
Application of the network theory framework to Indian tigers. (A) Map of the distribution of tigers with sampling locations, and fastSTRUCTURE plot. The figure is adapted from Natesh et al. (2017). Note that sample sizes for the fastSTRUCTURE plot include only subsets of individuals from Natesh et al. (2017). (B) Hypothetical sequence of past motif transitions proposed by Natesh et al. (2017) on the basis of genetic and historical data, presented in the framework of figure 4. (C) Possible future motif transitions, based on the transitions from motif 9 (fig. 4). For (B) and (C), motif 9 is taken to represent the current state of the population; percentages correspond to the proportion of within-subpopulation diversity change following each motif transition (from fig. 4).

