
Figure 3.
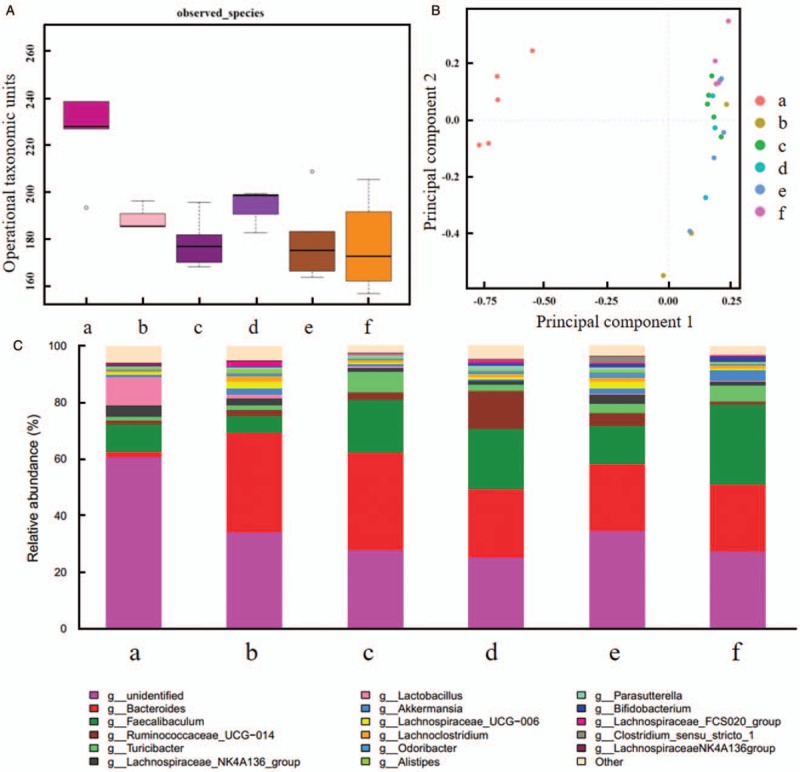
Comparison of intestinal flora for the fourth day of intervention (D4 feces). (A) Alpha diversity analysis. (B) Principal component analysis. (C) Taxonomic analysis. (a) Blank control group. (b) Model control group. (c) Probiotics group. (d) Synbiotics group. (e) Lactitol group. (f) Probiotics + lactitol group. Compared with blank control group, alpha diversity of the other five groups decreased significantly, there was no significantly different genus between synbiotics group and lactitol group, while other groups revealed distinctly different genus.