
Figure 5.
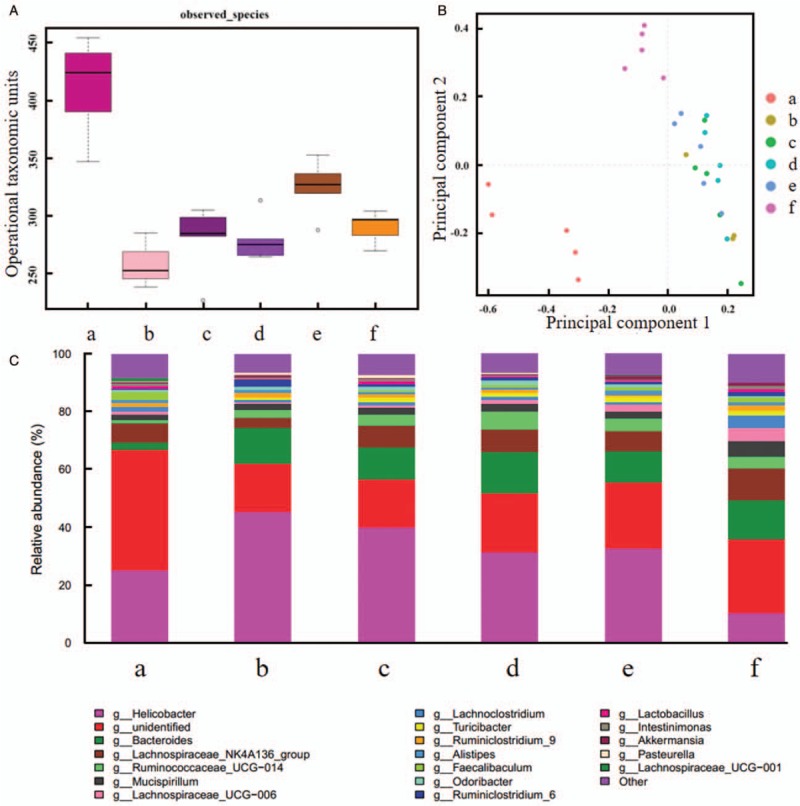
Comparison of intestinal flora for mucosa. (A) Alpha diversity analysis. (B) Principal component analysis. (C) Taxonomic analysis. (a) Blank control group. (b) Model control group. (c) Probiotics group. (d) Synbiotics group. (e) Lactitol group. (f) Probiotics + lactitol group. Alpha diversity of mucosa in five inflammatory groups was reduced than blank control group. There was no statistically significant genus between probiotics group and model control group, between synbiotics group and probiotics group. However, PCA indicated different genus among other groups.