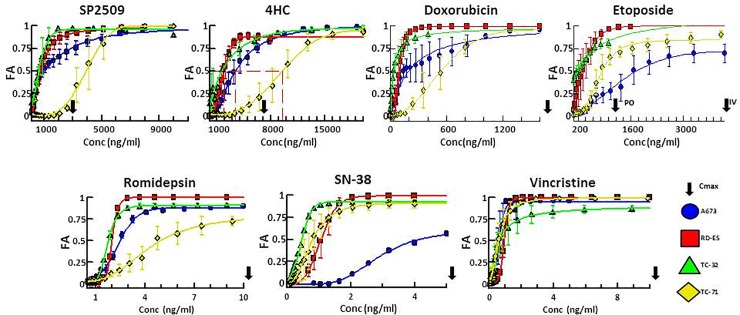
Fig 1. Single agent dose response plots for 7 tested agents against 4 ES cell lines demonstrate efficacy at clinically achievable concentrations.
Dose response plots of each drug tested across 4 cell lines plotted as fraction affected (FA) versus concentration (ng/ml). Data was recovered 72 hours after drug treatment. Plotted points represent the mean FA values while error bars represent ±SEM (standard error of the mean) between technical replicates. Arrows beyond the x-axis indicate a Cmax in excess of the values displayed.

