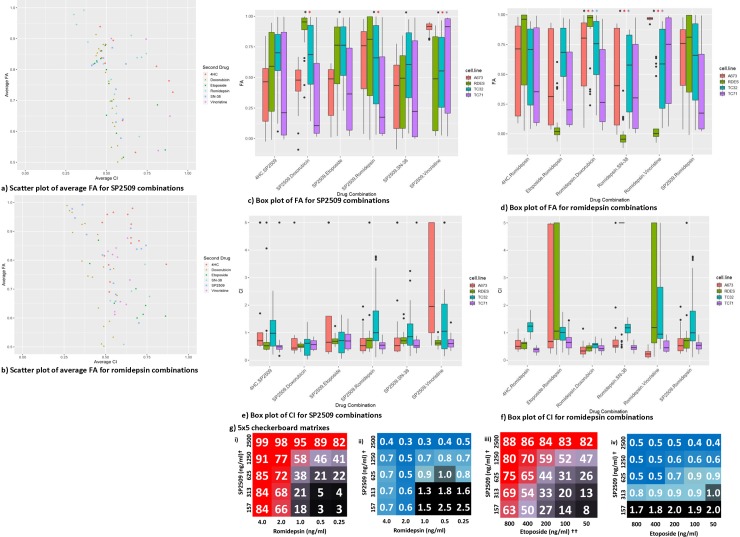
Fig 2. Overview of combination efficacy for SP2509 and romidepsin combinations.
Scatter plots displaying the average fraction of cells affected (FA) for drugs paired with a) SP2509 and b) romidepsin. Box plot for c) SP2509 exhibiting the FA of each cell line for all drug combinations. A black asterisk indicates a significantly higher FA value than 4HC+SP2509. P-values as follows: SP2509+doxorubicin = 1.87x10⁻²⁵, SP2509+etoposide = 2.54x10⁻¹⁶, SP2509+romidepsin = 6.72x10⁻¹⁵, SP2509+SN-38 = 2.81x10-08, SP2509+vincristine = 1.02x10⁻¹⁸. A red asterisk indicates a significantly higher FA value than SP2509+etoposide. P-values as follows: SP2509+doxorubicin = 1.66x10-09, SP2509+romidepsin = 3.43x10-06, SP2509+vincristine = 1.28x10⁻¹¹. A purple asterisk indicates a significantly higher FA than SP2509+doxorubicin. P-value as follows: SP2509+Vincristine = 3.19x10-05. Statistics based on combined value from all cell lines and all concentrations. Box plot for d) romidepsin exhibiting the FA of each cell line for all drug combinations. A black asterisk indicates significantly higher FA than romidepsin+etoposide. P-values as follows: romidepsin+doxorubicin = 8.56x10-07, romidepsin+SN-38 = 6.97x10-07, romidepsin+vincristine = 7.23x10⁻¹⁹. A red asterisk indicates significantly higher FA than romidepsin+SP2509. P-value as follows: romidepsin+doxorubicin = 0.00011, romidepsin+vincristine = 2.26x10⁻¹². A purple asterisk indicates significantly higher FA value than romidepsin+4HC. P-value as follows: romidepsin+vincristine = 8.11x10⁻¹¹. Statistics based on combined value from all cell lines and all concentrations. Box plots for e) SP2509 and f) romidepsin exhibiting the CI for each cell line for all drug combinations. g) 5x5 Checkerboard matrixes assessing combination activity. i) FA and ii) CI values for SP2509 and romidepsin assessed at 25 different concentrations. †Alternate SP2509 concentrations used (1000, 500, 250, 125, 62.5ng/ml for A673 and RD-ES cell lines; 2000, 1000, 500, 250, 125ng/ml used for TC32 cell line). Variable concentrations used due to differences in IC50 per cell line. iii) FA and iv) CI values for SP2509 and etoposide assessed at 25 different concentrations. ††Alternate etoposide concentrations used (300, 150, 75, 37.5, 18.8ng/ml used for A673 cell line).

