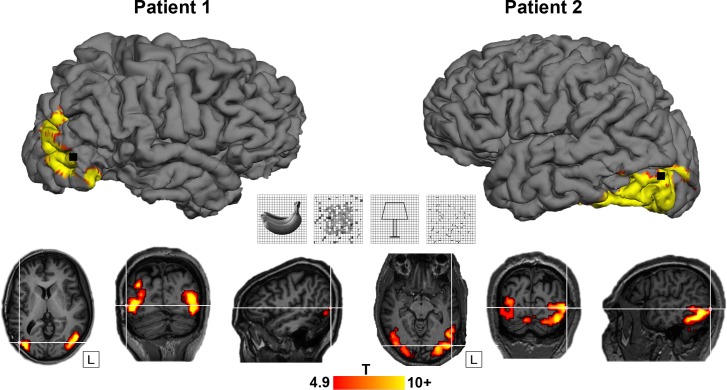
Fig 1. LOC localizer and location of arrays.
Top: site of Utah array implantation (black) projected onto 3D rendering of the brain in patient 1 (left) and patient 2 (right), overlayed with the fMRI LOC localizer activation (contrast [shapes + outlines] − [scrambled shapes + scrambled outlines]; p < 0.05, FWE-corrected for multiple comparisons). Center: LOC localizer stimuli (shapes, scrambled shapes, outlines, scrambled outlines), see [17]. Bottom: axial, coronal, and sagittal view. T-values plotted on T1-weighted image. Crosshair indicates the position of the Utah array in relation to the fMRI activation for both patients. The underlying data can be found at doi:10.5061/dryad.qd4vd71. 3D, three-dimensional; fMRI, functional magnetic resonance imaging; FWE, family-wise error; LOC, lateral occipital complex.

