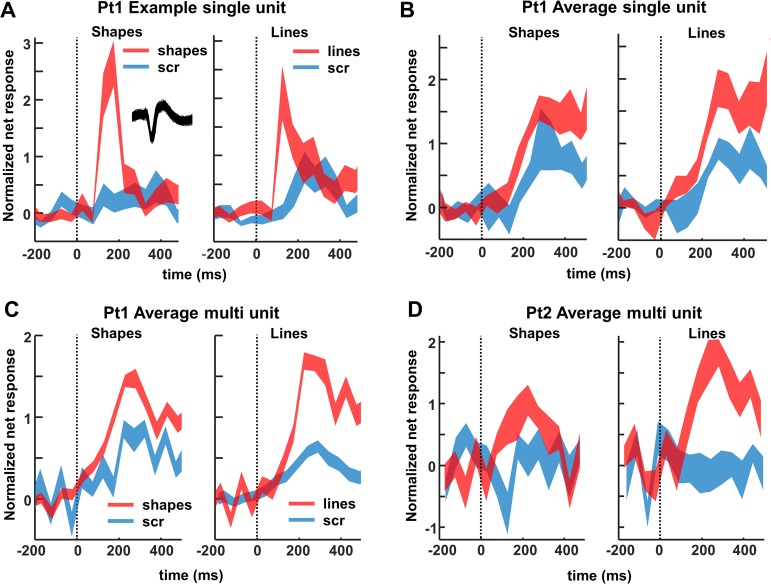
Fig 2. Single- and multi-unit normalized net response.
Net spike rate divided by the average spike rate for the best condition (50–300 ms after stimulus onset) to images of objects and scrambled controls. (A) Example neuron. Average response to intact (red) and scrambled (blue) shapes (left) and line stimuli (right). The inset illustrates the spike waveform. (B) Average single-unit responses across all visually responsive channels in patient 1. (C, D) Average multi-unit responses to intact and scrambled stimuli in patient 1 and 2, respectively, across all visually responsive channels. The underlying data can be found at doi:10.5061/dryad.qd4vd71. Pt1, patient 1; Pt2, patient 2; scr, scrambled.

