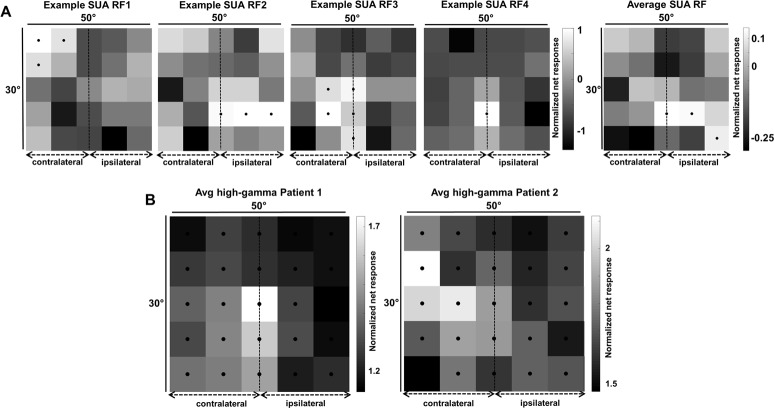
Fig 7. RF maps.
(A) Single-unit data. The first 4 panels show the RFs of 4 example neurons. All responses are normalized to the maximum visual response. Black dots indicate responses higher than 50% of the maximum response (per channel). Rightmost panel: average RF for all visually responsive channels. (B) Average RF for high-gamma responses for patient 1 (left) and patient 2 (right). The underlying data can be found at doi:10.5061/dryad.qd4vd71. RF, receptive field; SUA, single-unit activity.

