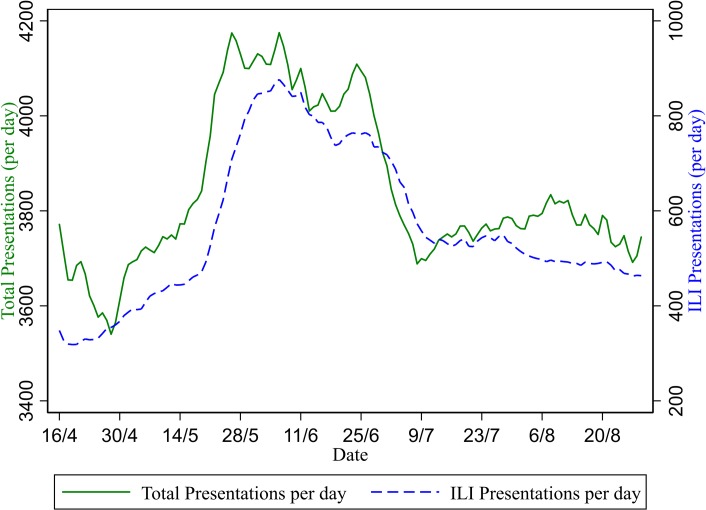
Fig 1. Total presentations per day and total ILI presentations per day (seven-day moving average).
The increase in ILI presentations observed in May and June 2009 can be divided into patients who were admitted into the hospital (including short stay wards and ICU) and those not admitted (Fig 2). This division shows two distinct patterns: the non-admitted patients peak on 6 June at 722 per day whereas the admitted presentations peak on 24 June at 180 per day.

