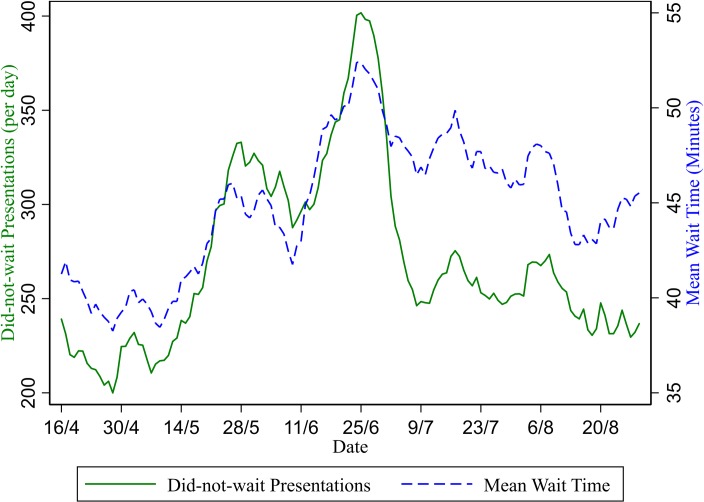
Fig 3. Average waiting time and number of did-not-wait presentations (seven-day moving average).
The seven-day average number of patients experiencing access block (Fig 4) increases from 285 per day on 15 May up to 296 per day on 6 June and then further to 377 per day (total increase of 32%) on 24 June at the peak of admitted presentations period.

