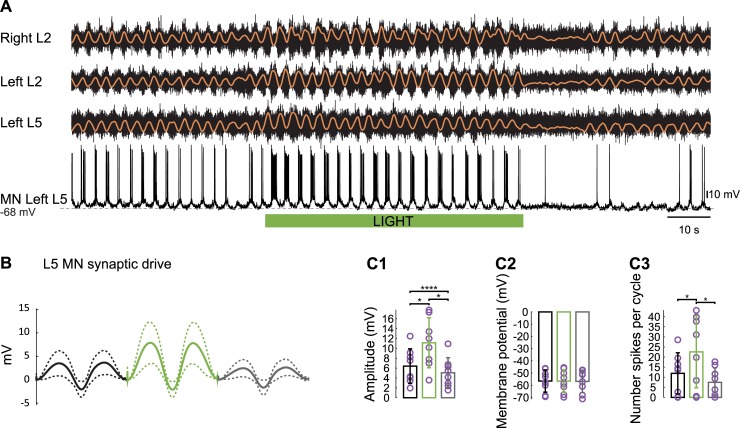
Fig 6. Light-induced hyperpolarization of V1 interneurons increases the rhythmic synaptic drive to MNs during drug-induced locomotor-like activity.
(A) Locomotor-like activity evoked by 5 μM NMDA, 10 μM 5-HT, and 50 μM DA in an En1-Arch spinal cord. The black traces show the high-pass (10 Hz) filtered signal from the right and left L2 and the left L5 ventral roots together with a flexor MN recorded from the left L5 segment. The superimposed orange traces are the integrated neurograms. (B) Cycle-triggered average (continuous line) and standard deviation (dotted lines) of the synaptic drive to an MN during fictive locomotion (two cycles) in an En1-Arch spinal cord (n = 8) before (black), during (green), and after (gray) illumination. (C) Bar plot of the amplitude of the synaptic drive ([C1]; Friedman test, p < 0.0001), the membrane potential ([C2]; Friedman test, p > 0.9999), and the number of spikes per cycle ([C3]; Friedman test, p = 0.0072) in MNs recorded in an En1-Arch spinal cord during fictive locomotion before (black), during (green), and after (gray) illumination. *p < 0.05, ****p < 0.0001. The data underlying this figure can be found in S5 Data. 5-HT, 5-hydroxytryptamine; Arch, archaerhodopsin-3; DA, dopamine; En1, engrailed-1; MN, motoneuron; NMDA, N-methyl-D-aspartate.

