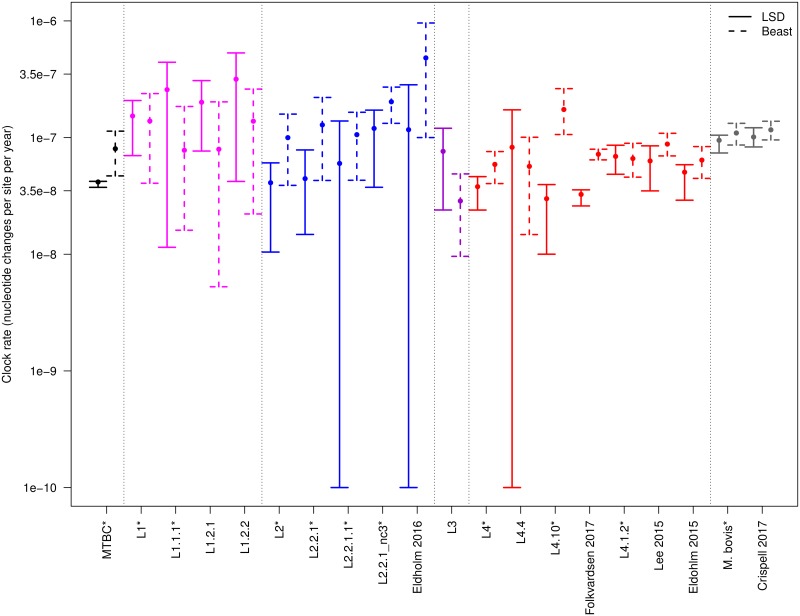
Fig 2. Estimated clock rates of all lineages, sub-lineages and local data sets that passed the DRT.
Solid lines represent the 95% confidence interval estimated with LSD, dashed lines represent the 95% highest posterior density (HPD) estimated by BEAST (the larger dot is the median of the posterior distribution). We show here the results of the BEAST analysis with the 1/x prior on the clock rate. For data sets that rejected the constant population size, we show the result obtained with the exponential population growth prior, for the other data sets we show the results obtained with the constant population size prior. Data sets marked with * have been reduced to 300 randomly picked strains for the BEAST analysis.

