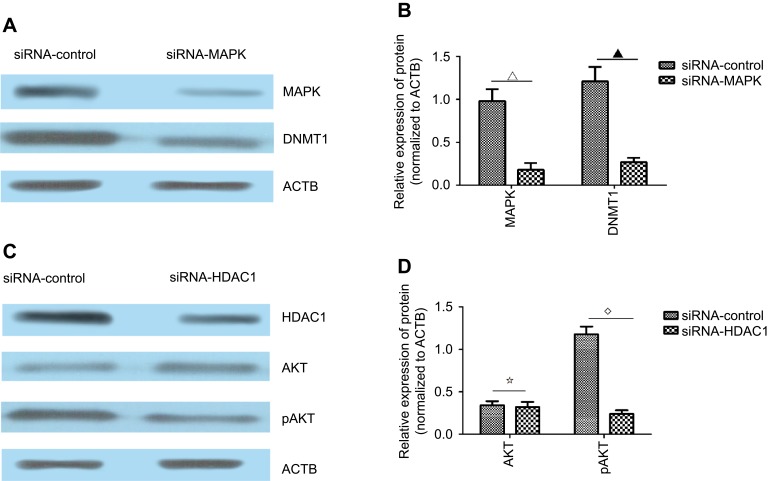
Figure 7.
(A) Western blot results showed the expression level of MAPK and DNMT1 after the knockdown of MAPK. (B) The expression levels of MAPK and DNMT1 were decreased after the knockdown of MAPK compared to the siRNA-control group (∇▁P<0.05). (C) Western blot results showed the expression level of HDAC1, AKT, and pAKT after the knockdown of HDAC1. (D) The expression levels of AKT and pAKT were decreased after the knockdown of HDAC1 compared to the siRNA-control group (⢶⋄P<0.05).

