Figure.
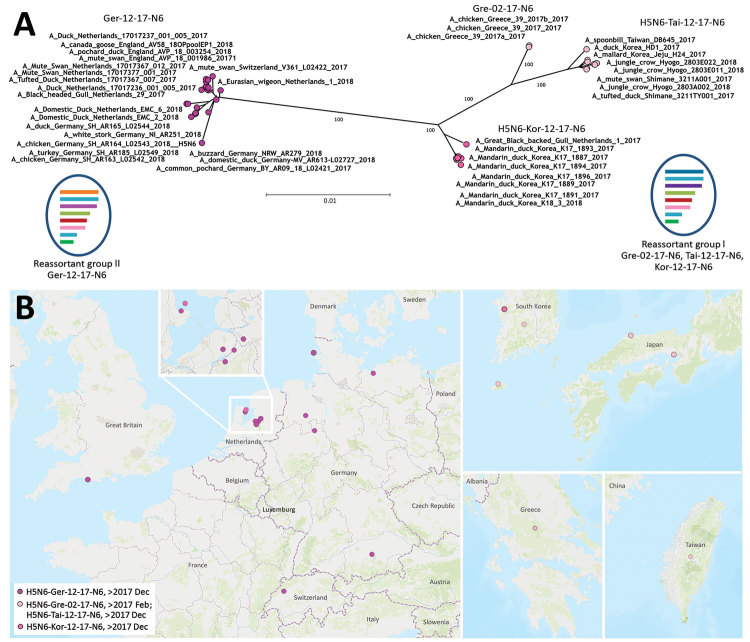
Phylogenetic clustering and geographic distribution of highly pathogenic avian influenza A(H5N6) viruses, Europe, 2017–2018. A) Supernetwork generated by using maximum-likelihood trees of influenza virus full genomes with RAxML (https://cme.h-its.org/exelixis/web/software/raxml/index.html) and 1,000 bootstrap iterations followed by network analysis with SplitsTree4 (http://ab.inf.uni-tuebingen.de/software/splitstree4). Reassortant viruses are grouped according to their phylogenetic results. Scale bar indicates nucleotide substitutions per site. The mosaic genome structure of reassortant groups I and II is also provided. Gene segment descriptions are given in Appendix Figure). B) Geographic locations of cluster isolates. Inset of cluster in the Netherlands is provided for easier visualization. L, Luxembourg.

