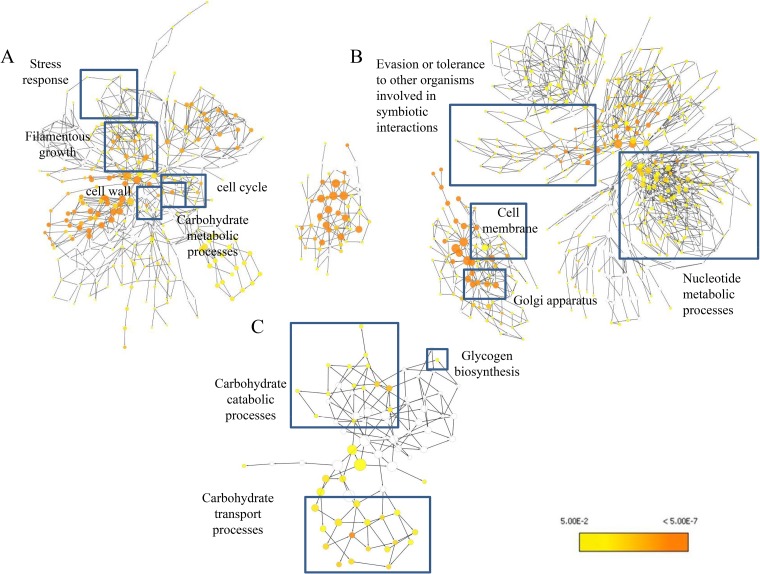
FIG 3.
Gene ontology pathway analysis. GO pathway maps for C. albicans upregulated genes (A), C. albicans downregulated genes (B), and S. mutans upregulated genes (C) are shown. Uncolored nodes represent GO categories that are not overrepresented. Yellow nodes represent GO categories that are overrepresented at a significant level. The node color becomes increasingly more orange when the P values are more significant.

