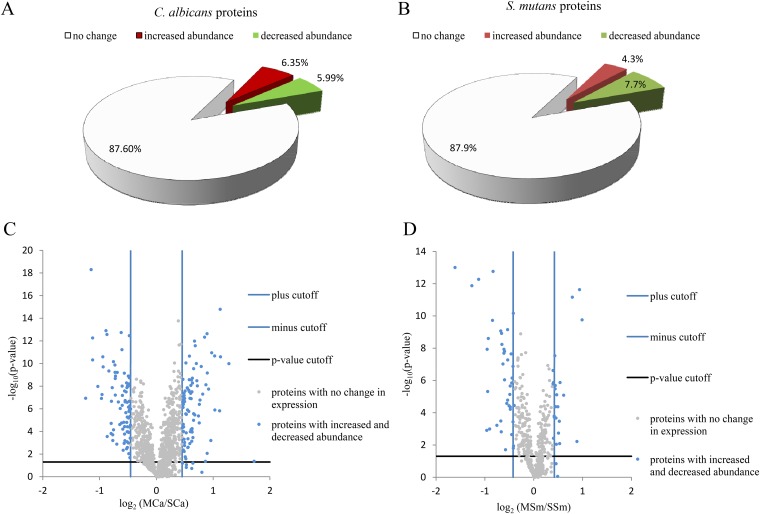
FIG 4.
Expression of C. albicans and S. mutans proteins in the mixed-species biofilm. (A and B) Pie charts showing percentage of the number of proteins showing “no change,” “increased abundance,” or “decreased abundance” in the mixed-species biofilm versus single-species biofilm of C. albicans (A) and S. mutans (B). (C and D) Volcano plots showing the distribution of the expression of C. albicans (C) and S. mutans (D) proteins in the mixed-species biofilm compared to single-species biofilms. The fold cutoff values (blue lines) are indicated, along with the P value cutoff (black lines).

