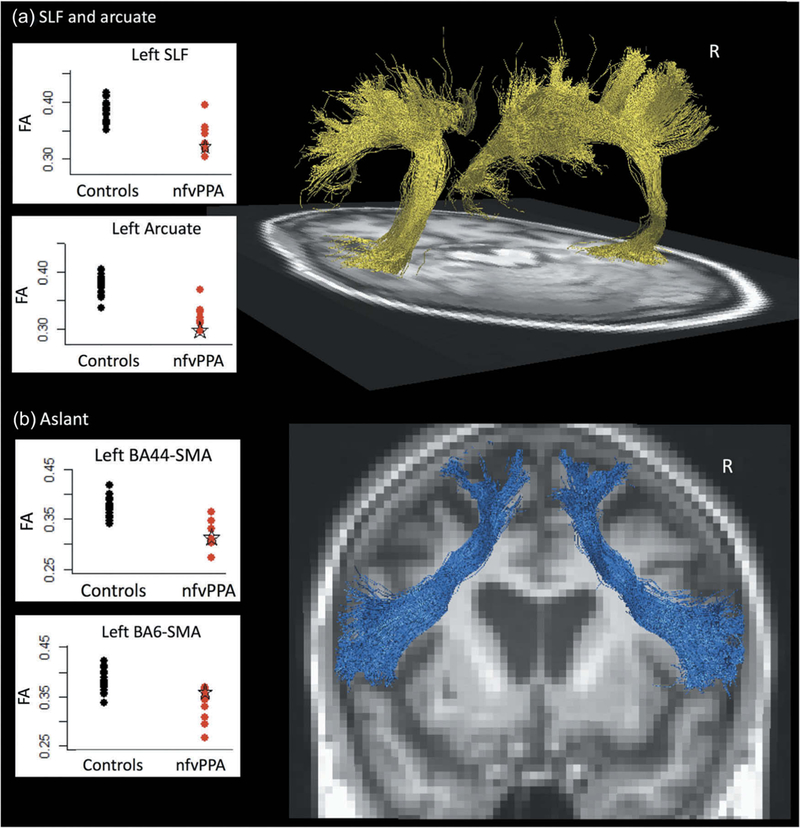
Figure 4.

Tractography and average fractional anisotropy (FA) of patient’s (a) superior longitudinal fasciculus and arcuate tracts and (b) aslant tract at age 67. Black dots represent a cohort of 21 controls, and red dots represent a cohort of 9 nfvPPA patients, with the patient’s results indicated by a green star.
