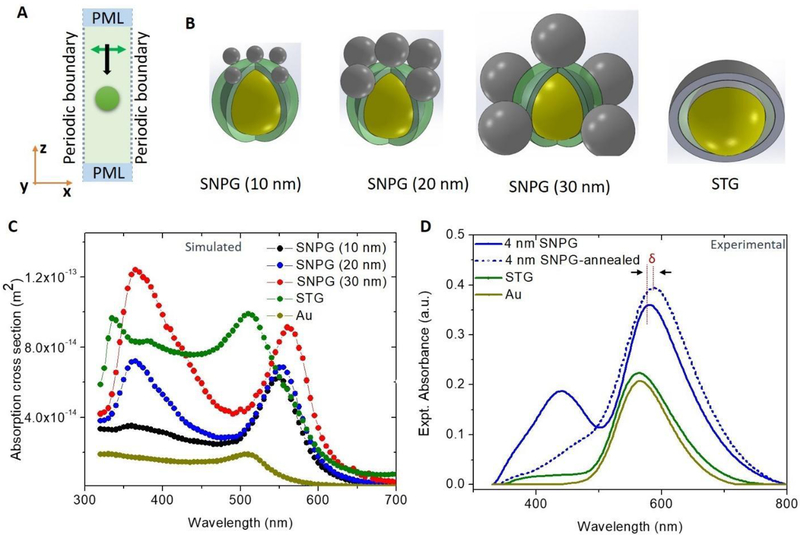
Figure 2:
Optical characterization of the fabricated structures, numerical and experimental: (A) FEM 3D model with periodic boundary in the X and Y direction implying the nanostructure (represented by the orange sphere) repeats periodically in the X and Y direction infinitely. The electromagnetic field propagates along the Z direction and is linearly polarized along the X direction represented by the black and the green arrow, respectively. (B) Schematic showing various nanostructure configurations along with their respective labels (which have been used throughout this report). The yellow sphere represents the gold sphere, which is coated with silica (represented by semi-transparent green). The silver nanostructures are in gray color. (C) Simulated absorption spectra for different numerical configurations are plotted along with absorption spectra of a gold sphere. (D) Experimental absorption spectra of various fabricated samples – 4nm SNPG, 4 nm SNPG after annealing, STG and gold islands. δ signifies the shift in peak position of the SNPG sample due to annealing.

