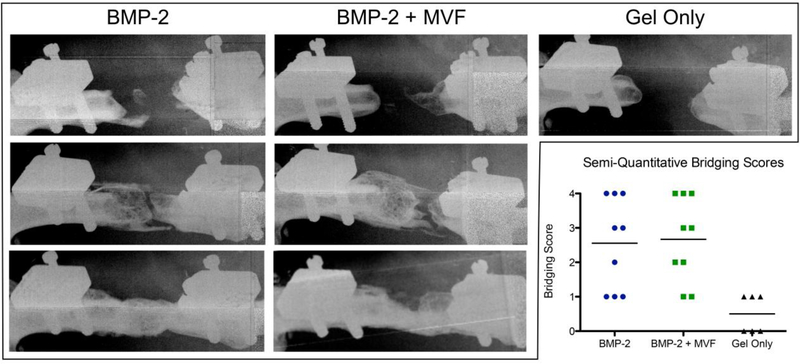
Figure 7.
Representative 12 week radiographs of non-mineralized (top; bridging score 0–1), mineralized but not bridged (middle; bridging score 2–3), and completely bridged (bottom; bridging score 4) samples from each treatment group. The Gel Only group produced only nonmineralized samples. Inset chart shows the semi-quantitative bridging score distribution and mean for each group.

