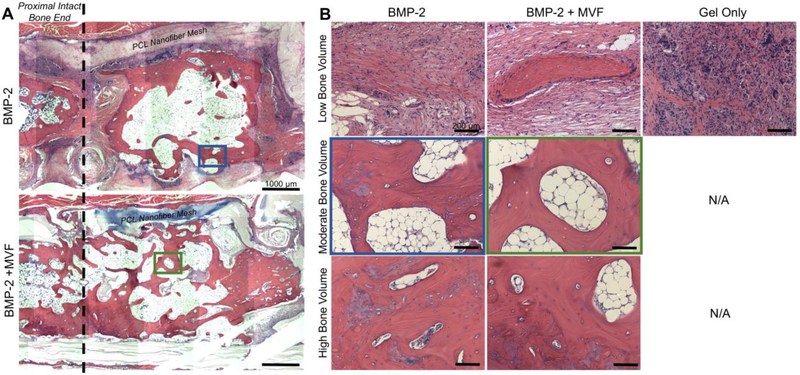
Figure 9.
A) Representative mosaic images of hematoxylin and eosin (H&E) stained samples from the BMP-2 (top) and BMP-2+MVF (bottom) treatment groups. The PCL nanofiber mesh denotes the boundaries of the defect area, and the proximal intact bone end is marked with dotted line. Scale bar = 1000 μm. B) Representative low (top), moderate (middle), and high (bottom) bone volume samples from each treatment group at the 12 week endpoint. The Gel Only group produced only low bone volume samples. Location of moderate bone volume samples within mosaics are outlined in blue and green for the BMP-2 and BMP-2 + MVF groups, respectively. Scale bar = 200 μm.

