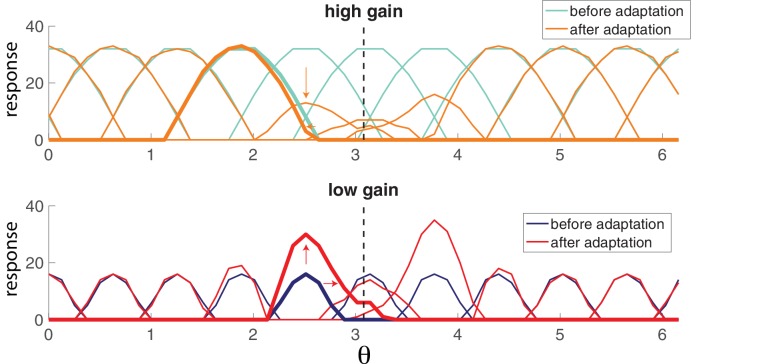
Figure 6. Population adaptation tuning curves show neuron responses to a full range of test orientations (x-axis) after adaptation to a single orientation (black dashed line).
Top, tuning curves for strongly excitable neurons before adaptation (light blue) are broad. After adaptation (orange), tuning curves near the adaptor are suppressed. Bottom, tuning curves for weakly excitable neurons before adaptation (dark blue) show less activation than for high gain neurons and more specific tuning. After adaptation (red), flanking curves are facilitated and shifted toward adaptor. [, , stimulus magnitude C = 50, 200 neurons].

