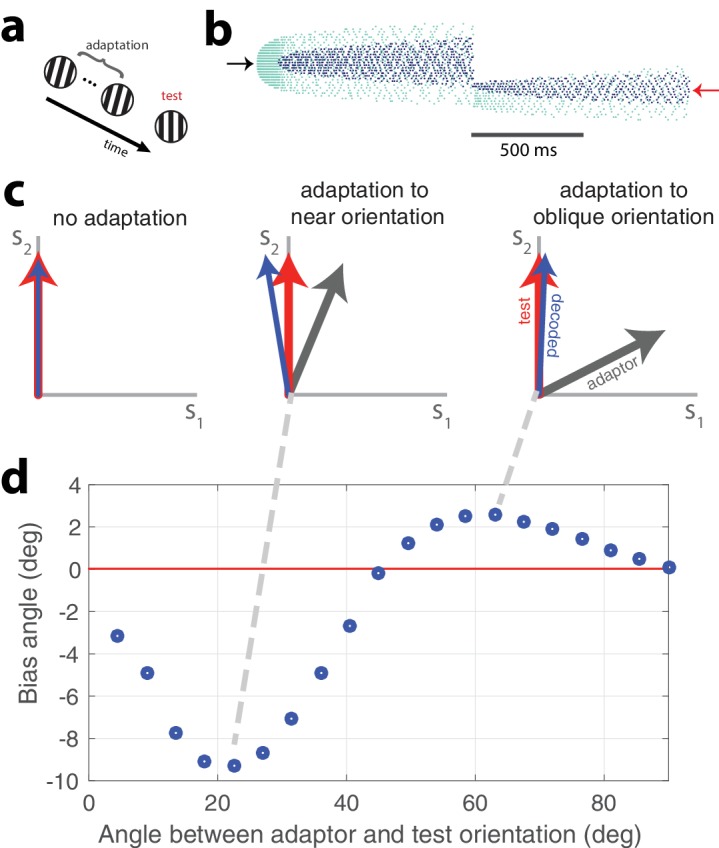
Figure 8. Tilt illusion.

(a) Schematic of tilt adaptation protocol. (b) Network activity in response to an adapting stimulus followed by a test stimulus. Rasters are ordered by neurons’ orientation preferences. Black arrow, neurons that prefer adapting orientation; red arrow, neurons that prefer test orientation (, 200 neurons, adaptor C = 50, test C = 25). (c) Examples of tilt bias: (left) no bias before adaptation, (middle) network estimate is biased away from test stimulus and adaptor when adaptor is near test orientation, (right) estimate is biased towards adaptor when adaptor is at large angle to test stimulus (red arrow, test orientation; grey arrow, adaptor; blue arrow, decoded orientation to test orientation after adaptation). (d) Estimate bias is repulsive for near adaptation and attractive for oblique adaptation. Adaptor is presented for 2 s and test orientation is presented for 250 ms (, adaptor C = 25, test C = 5).
