. 2019 Sep 24;8:e46922. doi: 10.7554/eLife.46922

Figure 2. Effects of parental age and sex on autosomal DNM counts and mutation types in the second generation.

(a) Numbers of phased paternal and maternal de novo variants as a function of parental age at birth. Poisson regressions (with 95% confidence bands, calculated as 1.96 times the standard error) were fit for mothers and fathers separately using an identity link. Germline mutation rates, as a function of both paternal and maternal ages, are presented in Figure 2—figure supplement 1. (b) Mutation spectra in autosomal DNMs phased to the paternal (n = 3,584) and maternal (n = 880) haplotypes. Asterisks indicate significant differences between paternal and maternal fractions at a false-discovery rate of 0.05 (Benjamini-Hochberg procedure), using a Chi-squared test of independence. P-values for each comparison are: C > G: 0.719, T > G: 4.93e-3, T > A: 8.60e-2, T > C: 8.02e-2, C > A: 0.159, C > T: 7.65e-6, indel: 8.01e-2, CpG >TpG: 0.835. Mutation spectra stratified by parental ages are presented in Figure 2—figure supplement 2.

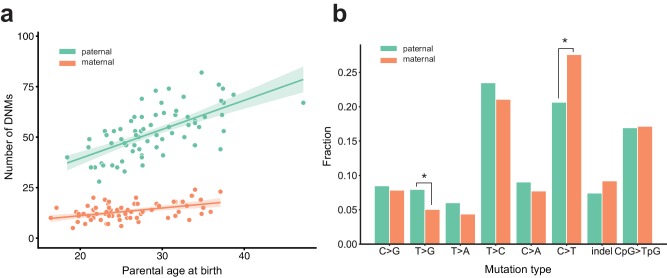
Figure 2.

Figure 2—figure supplement 1. Contribution of maternal and paternal age to de novo mutation rates.

Figure 2—figure supplement 1.

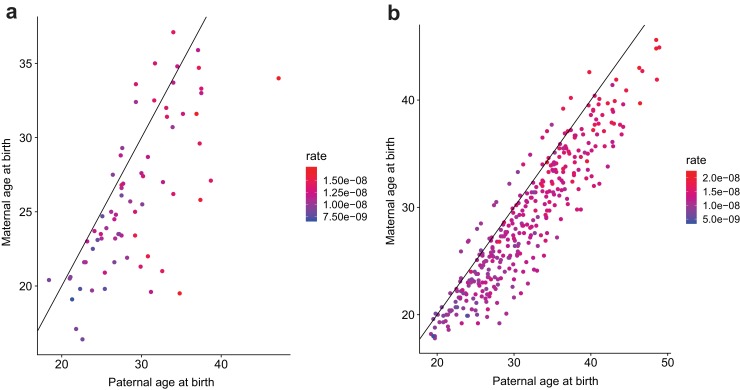
For (a) second- and (b) third-generation individuals in the CEPH/Utah cohort, plotted points show the relationship between paternal and maternal age at birth.Each point is colored by the autosomal SNV mutation rate in the individual; these rates were calculated by dividing the autosomal SNV DNM count in each child by that child’s autosomal callable fraction. Colors indicate the magnitude of the mutation rate (blue = lower, red = higher). Black lines indicate the trend for a 1:1 relationship between paternal and maternal age.
Figure 2—figure supplement 2. Comparison of mutation spectra in children born to older or younger parents.

Figure 2—figure supplement 2.

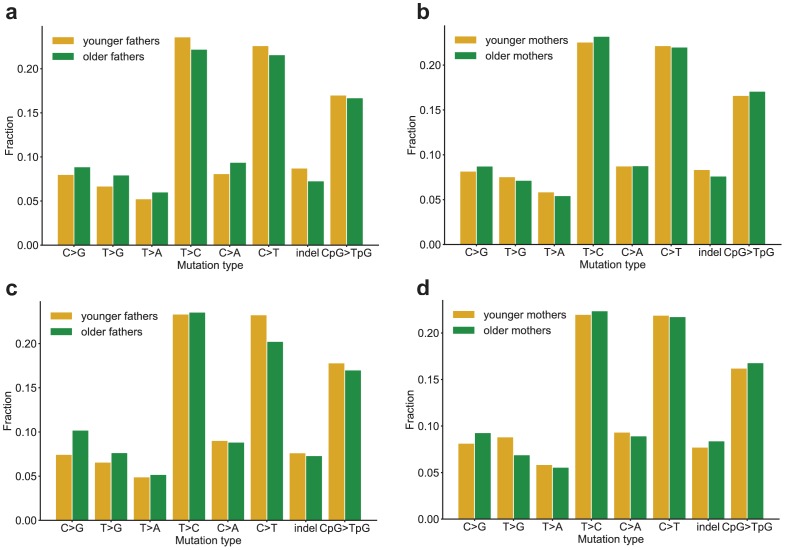
Second-generation children were divided into two groups based on the ages of their parents at birth, and autosomal mutation spectra were compared between the two groups. In all panels, no significant differences were found at a false-discovery rate of 0.05 (Benjamini-Hochberg procedure), using a Chi-squared test of independence. (a) Comparison of DNMs in children born to fathers younger (n = 2,182) or older (n = 2,360) than the median paternal age of 29.2 years. P-values for each comparison are: C > G: 0.304, T > G: 0.140, T > A: 0.306, T > C: 0.248, C > A: 0.8.81e-2, C > T: 0.444, indel: 6.89e-2, CpG >TpG: 0.810. (b) Comparison of DNMs in children born to mothers younger (n = 2,225) or older (n = 2,317) than the median maternal age of 25.7 years. P-values for each comparison are: C > G: 0.580, T > G: 0.659, T > A: 0.554, T > C: 0.697, C > A: 0.918, C > T: 0.990, indel: 0.371, CpG >TpG: 0.678. (c) Comparison of DNMs in children born to fathers in the 25th percentile of youngest (n = 1,120) or oldest (n = 1,165) paternal ages (26.4 or 34 years). P-values for each comparison are: C > G: 1.73e-2, T > G: 0.428, T > A: 0.872, T > C: 0.979, C > A: 0.943, C > T: 7.77e-2, indel: 0.788, CpG >TpG: 0.706. (d) Comparison of DNMs in children born to mothers in the 25th percentile of youngest (n = 1,169) or oldest (n = 1,121) maternal ages (22.5 or 31.4 years). P-values for each comparison are: C > G: 0.327, T > G: 9.92e-2, T > A: 0.841, T > C: 0.975, C > A: 0.963, C > T: 0.940, indel: 0.598, CpG >TpG: 0.780.