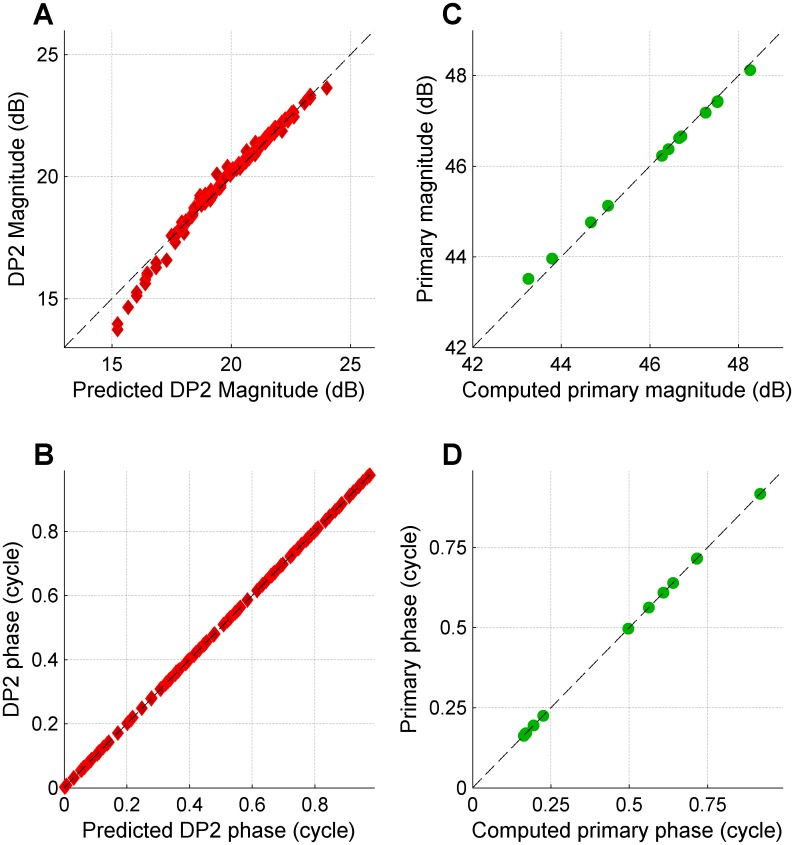
Appendix 1—figure 1. Predicting the DP2 spectrum from a primary spectrum and vice versa; no low-pass filtering.
(A) Actual DP2 magnitudes obtained by rectifying (not followed by filtering) the tone complex with unequal primary magnitudes shown in Figure 2C, left panel, plotted against the approximation of Equation 1. (B) As in (A), but now for the phase. (C) Retrieving the primary magnitudes from the DP2 spectrum by inverting (fitting) Equation 1. Actual primary magnitudes are plotted versus computed magnitude. (D) As in (C), but now for the phase.

