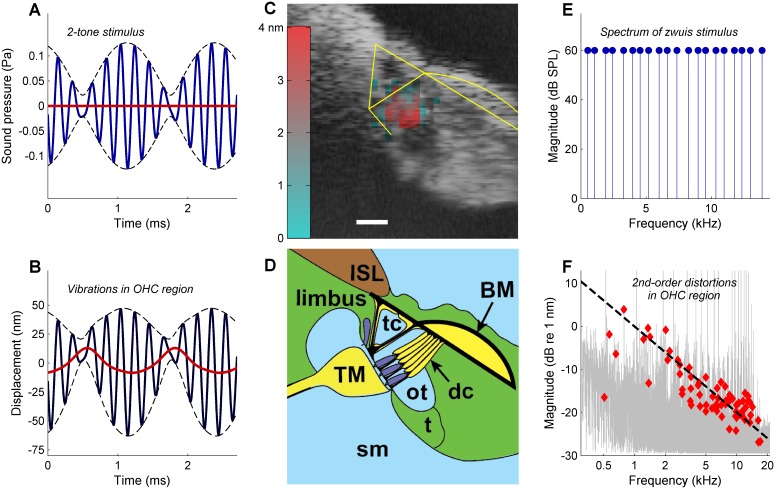
Figure 1. Rectification in the mechanical response of OHCs.
(A) Two-tone stimulus with primary frequencies 4600, 5400 Hz; 70 dB SPL. Blue line, waveform; dashed black lines, envelope; red line, lowpass-filtered waveform (2000-Hz cut-off). (B) Mechanical displacement evoked by the two-tone stimulus, recorded in the gerbil OHC/Deiters’ cell region (13 kHz CF). Black line, displacement waveform; dashed black lines, envelope. Rectification is illustrated by the red line obtained by low-pass filtering (2000-Hz cut-off). Positive polarity indicates displacement away from the measurement probe, that is vertically downwards in (C) and (D). (C) OCT reflectance image (grayscale), with structural framework of Corti’s organ (yellow) superimposed for reference. Color-coded overlay: total RMS value of 2nd-order distortion products (DP2s) evoked by a 12-tone complex, 2–12 kHz; 60 dB SPL. DP2s dominate in the OHC region. Scale bar, 0.025 mm. (D) Underlying anatomical structures. BM = basilar membrane; ISL = inner spiral lamina; sm = scala media; dc = Deiters’ cells; t = tectal cells; TM = tectorial membrane; tc = tunnel of Corti; ot = outer tunnel. Hair cells, dark blue. (E) Zwuis stimulus (see text). (F) Vibration spectrum recorded in OHC region in response to the zwuis stimulus. Red diamonds, Rayleigh-significant DP2s. Dashed line, 6-dB/octave roll-off.


