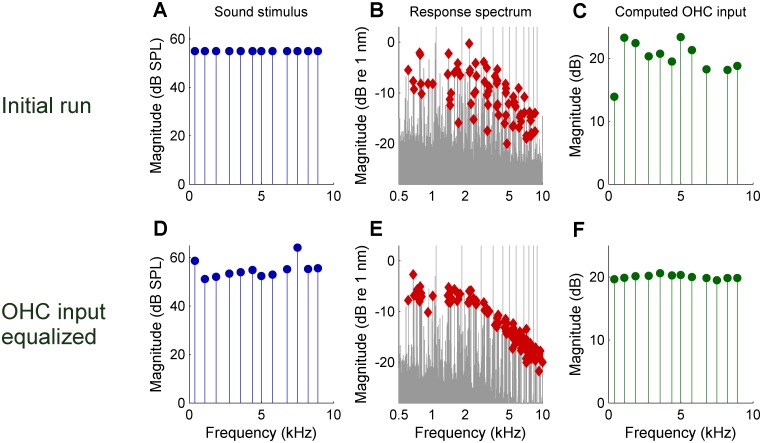
Figure 3. Reducing the scatter of DP2 magnitudes by equalizing the effective OHC input during an experiment.
(A) Spectrum of the initial zwuis acoustic stimulus. (B) Spectrum of the vibrations recorded in the OHC region; CF = 16 kHz. Rayleigh-significant DP2s marked as red diamonds; 2nd harmonics corrected for the 6-dB combinatorial effect. (C) Effective OHC input computed from the DP2 magnitudes. (D) Spectrum of the adapted stimulus (4th iteration) aimed at equalizing the effective OHC input. (E) Resulting DP2 spectrum. (F) Effective OHC input. Note that the equalized input spectrum in F (compared to C) reduces the DP2 scatter in E (compared to B).

