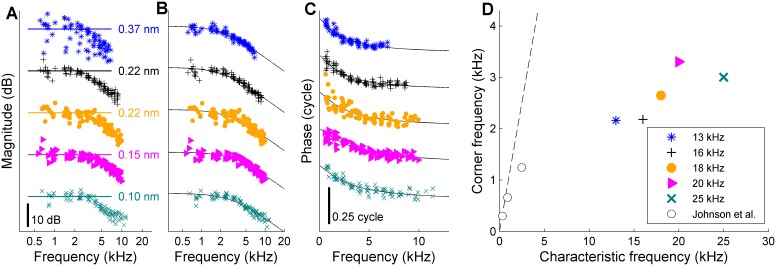
Figure 4. Low-pass filtering and corner frequencies of OHCs.
(A) DP2 magnitude versus frequency measured across different cochleas at different CFs. Stimuli, 10–12 component zwuis not exceeding CF/2; component intensities 55–65 dB SPL, optimized to equalize OHC input. Individual curves are offset to avoid overlap; labeled straight lines indicate absolute displacement. CFs, see legend of panel D. Second harmonics were corrected for the 6-dB combinatorial deficiency. (B) The same magnitudes corrected post-hoc for the effects of residual magnitude inequality in the effective input (see Appendix 1—figure 3). Black lines, first-order low-pass filters fitted jointly to the magnitude and phase data of each recording. (C) Companion phase data: the difference between the recorded DP2 phases and the predictions obtained by adding or subtracting the primary phases of the OHC input (Appendix 1, Equation 3B). Black lines, phase curves of the fitted low-pass filters. (D) Corner frequencies from the fits versus CF. Symbols as in panels A-C. Open circles reproduce in vitro data from Johnson et al. (2011). Dashed line, unity line (corner frequency = CF). Explained variance of the fits (in order of increasing CF): 90%, 91%, 80%, 85%, 87%. When omitting the correction for residual scatter, and instead using the raw magnitudes from panel A, the estimates of the corner frequencies were lower by 1% to 10% (mean, 7%) compared to the estimates based on the corrected magnitudes. Captions of source Data.


