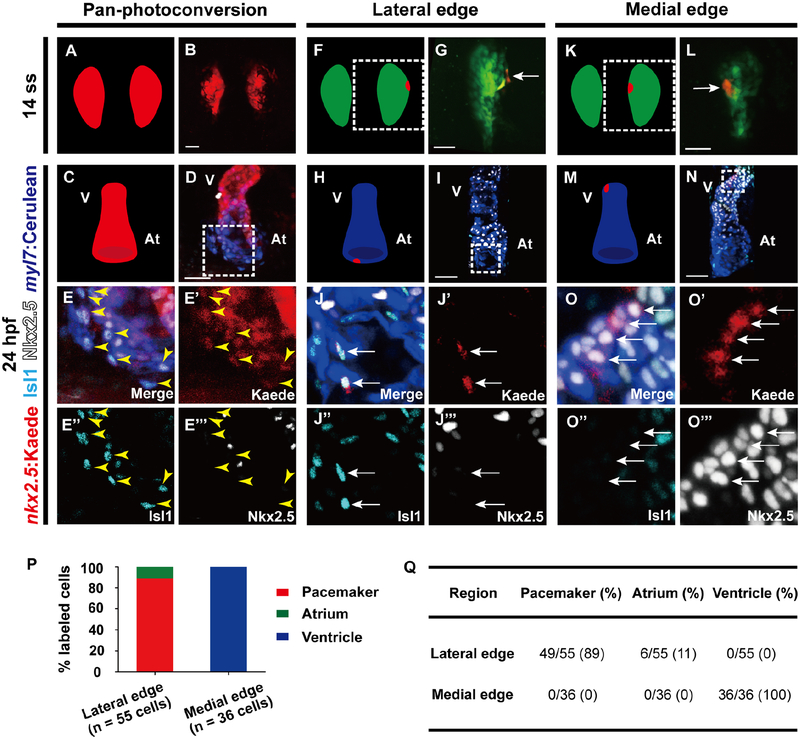
Figure 1. Pacemaker cells originate from the most lateral edge of the nkx2.5+ progenitor fields residing within the ALPM.
Confocal imaging of Tg(nkx2.5:Kaede; myl7:Cerulean) embryos shows the location of nkx2.5:Kaede cells immediately after photoconversion at (B, G, L) 14 ss as well as respectively later at (D, E, I, J, N, O) 8 hours post-photoconversion at 24 hpf. Immunostaining detects Isl1 and Nkx2.5 expressing cells. (A, C, F, H, K, M) Schematics illustrate the position of photoconverted (red) and non-photoconverted (green) nkx2.5:Kaede cells as well as myl7:Cerulean cardiomyocytes (blue) for B, D, G, I, L, N images, respectively. (A-E’’’) Pan-photoconversion of Tg(nkx2.5:Kaede; myl7:Cerulean) embryos at 14 ss results in photoconverted nkx2.5:Kaede+ Isl1+ myl7:Cerulean+ pacemaker cardiomyocytes at 24 hpf (n = 201/212 Isl1+ myl7:Cerulean+ pacemaker cardiomyocytes from 8 embryos). (F-O’’’) Localized photoconversion of nkx2.5:Kaede at the (F-J’’’) lateral or (K-O’’’) medial edge at 14 ss reveals that the lateral edge of nkx2.5+ cardiac mesoderm, but not the medial edge, contributes to pacemaker cardiomyocytes at 24 hpf. (E-E’’’, J-J’’’, O-O’’’ and G, L) Insets are magnifications of boxed areas in D, I, N and F, K, respectively. Images E’-E’’’, J’-J’’’, O’-O’’’ are single channels from E, J, O merged images, respectively. Yellow arrowheads point to (E-E’’’) photoconverted nkx2.5:Kaede+ Isl1+ myl7:Cerulean+ pacemaker cardiomyocytes. White arrows point to (G, J-J’’’, L, O-O’’’) photoconverted nkx2.5:Kaede cells. Green – (G, L) non-photoconverted nkx2.5:Kaede; Red – (B, D, E, E’, G, I, J, J’, L, N, O, O’) photoconverted nkx2.5:Kaede; Cyan – (D, E, E’’, I, J, J’’, N, O, O’’) anti-Isl1 immunostaining; White – (D, E, E’’’, I, J, J’’’, N, O, O’’’) anti-Nkx2.5 immunostaining; Blue – (D, E, I, J, N, O) myl7:Cerulean. (P) Quantification of the localized photoconversion studies reveal that 14 ss nkx2.5:Kaede cells photoconverted at the most lateral edge of the nkx2.5+ mesoderm contribute primarily to pacemaker cardiomyocytes (red bar) along with a few atrial cardiomyocytes (green bar), whereas those photoconverted at the medial edge mainly supply ventricular cardiomyocytes (blue bar). (Q) Table summarizes the results of localized nkx2.5:Kaede photoconversion studies at the lateral (n = 55 cells from 24 embryos) and medial edge (n = 36 cells from 8 embryos). At, atrium; V, ventricle. Scale bar, 50 μm. See also Figure S1.

