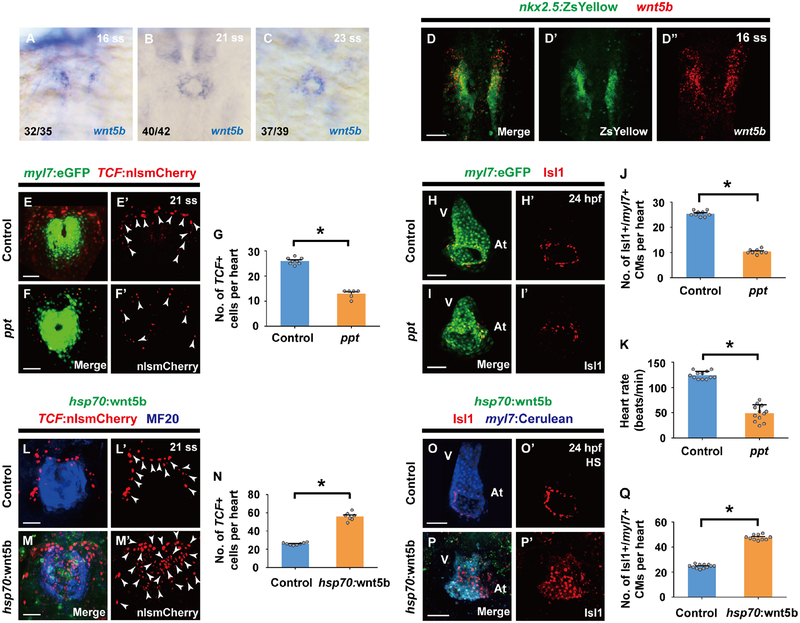
Figure 5. Wnt5b is required for canonical Wnt activation during pacemaker cardiomyocyte development.
(A-C) In situ hybridization analyses reveals wnt5b expression within the ALPM at (A) 16 ss as well as in the cardiac mesoderm at (B) 21 ss and (C) 23 ss. (D-D’’) wnt5b RNAscope in situ hybridization in Tg(nkx2.5:ZsYellow) wild-type embryos (n = 12 embryos) shows that there is an overlap in nkx2.5:ZsYellow and wnt5b expression at 16 ss. (E-F’, H-I’) Confocal images of (E-F’) Tg(myl7:eGFP; TCF:nlsmCherry) (E-E’) wild-type control (n = 8 embryos) or (F-F’) ppt mutant embryos (n = 6 embryos) at 21 ss and (H-I’) anti-Isl1 immunostaining of Tg(myl7:eGFP) (H-H’) wild-type control (n = 9 embryos) or (I-I’) ppt mutant embryos (n = 8 embryos) at 24 hpf show that loss of wnt5b (ppt) leads to less TCF:nlsmCherry+ cells in the outlying regions of the cardiac mesoderm and subsequently fewer Isl1+/myl7+ pacemaker cardiomyocytes at the inflow tract region. Conversely, overexpressing wnt5b by (M-M’, P-P’) heat-shocking Tg(hsp70:wnt5b) embryos (n = 7, 10 embryos) at 16 ss results in increased TCF:nlsmCherry+ cells in the cardiac mesoderm at 21 ss and increased Isl1+/myl7+ pacemaker cardiomyocytes at the inflow tract region at 24 hpf compared to (L-L’, O-O’) non-transgenic heat-shocked sibling controls (n = 8, 12 embryos). Images D’, D’’, E’, F’, H’, I’, L’, M’, O’, P’ are single channels from D, E, F, H, I, L, M, O, P merged images, respectively. Green – (D, D’) nkx2.5:ZsYellow, (E, F, H, I) myl7:eGFP, (M, P) hsp70:wnt5b; Red – (D, D’’) wnt5b RNAscope in situ hybridization probe, (E-F’, L-M’) TCF:nlsmCherry, (H-I’, O-P’) anti-Isl1 immunostaining; Blue – (L, M) anti-MF20 immunostaining, (O, P) myl7:Cerulean. White arrowheads point to TCF:nlsmCherry+ cells. (G, J, N, Q) Bar graphs show the average number of (G, N) TCF:nlsmCherry+ cells per heart for E-F’ and L-M’ conditions, and (J, Q) Isl1+/myl7+ pacemaker cardiomyocytes (CMs) per heart for H-I’ and O-P’ conditions, respectively. (K) Bar graph shows the heart rate for wild-type control (n= 12 embryos) and ppt mutant embryos (n= 12 embryos) at 48 hpf. For in situ hybridization studies in A-C, ratios indicate the number of embryos displaying the respective gene expression pattern versus total number of embryos analyzed. Scale bar, 50 μm. Mean ± s.e.m. *P< 0.05 by Student’s t-test. See also Figure S3 and S6.

