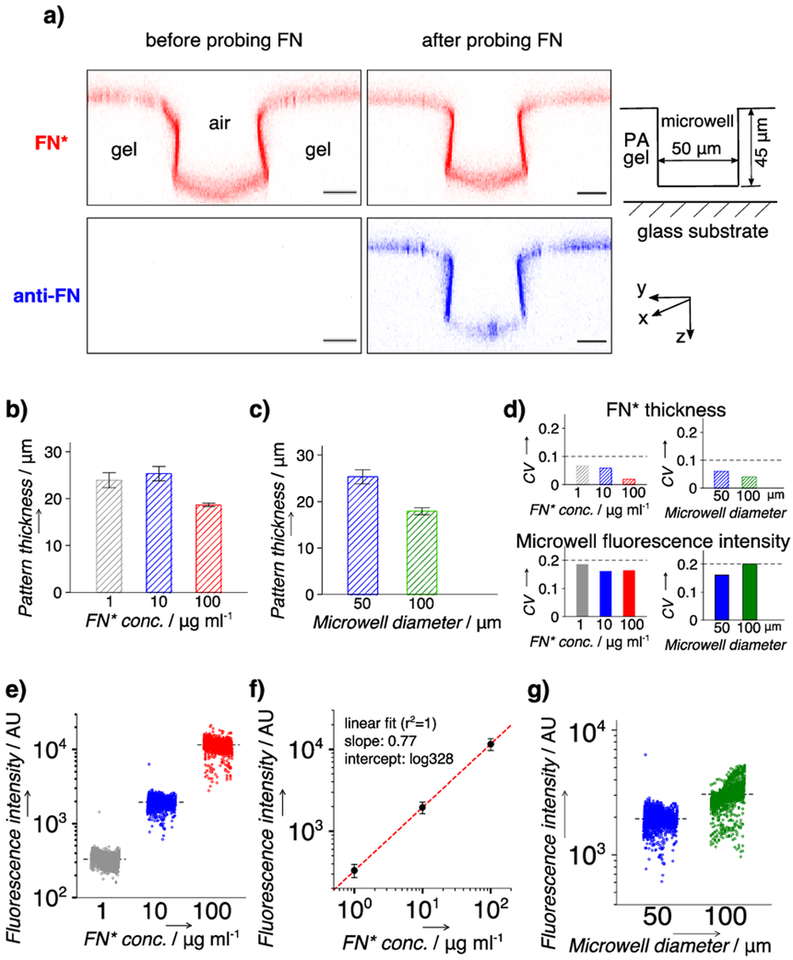
Figure 2.
Characterization of the fibronectin (FN) layer in microwells on the in situ scWB device. a) Representative false-color confocal fluorescence micrographs (cross section along y-z plane) indicating a thin layer of rhodamine-labeled FN (FN*) at the surface of the in situ scWB device. Microwell: diameter, 50 μm; height, 40 μm. Red: FN*. Blue: FN* probed with AlexaFluor 647-labeled antibody (anti-FN). Scale bar: 20 μm. b) Quantitated thickness of the FN* layer on in situ scWB devices of varied applied FN* concentrations (FN* conc.). c) Quantitated thickness of the FN* layer on in situ scWB devices of varied microwell diameters. n = 3. Error bar: standard deviation. d) Coefficient of variation (CV) of FN* thickness (top) and average microwell fluorescence (bottom). Straight lines are drawn to indicate the values of 0.1 (top) and 0.2 (bottom). e) Average microwell fluorescence from in situ scWB devices spanning various applied FN* concentrations. f) Linear fit to the average fluorescence intensities at each FN* concentration in e). g) Average microwell fluorescence from in situ scWB devices of various microwell diameters. Black lines in e) and g): mean value, n >1900 for each group. Error bars: standard deviation. Unless otherwise specified, the microwell diameter is 50 μm and the applied FN or FN* concentration is 10 μg ml−1.

