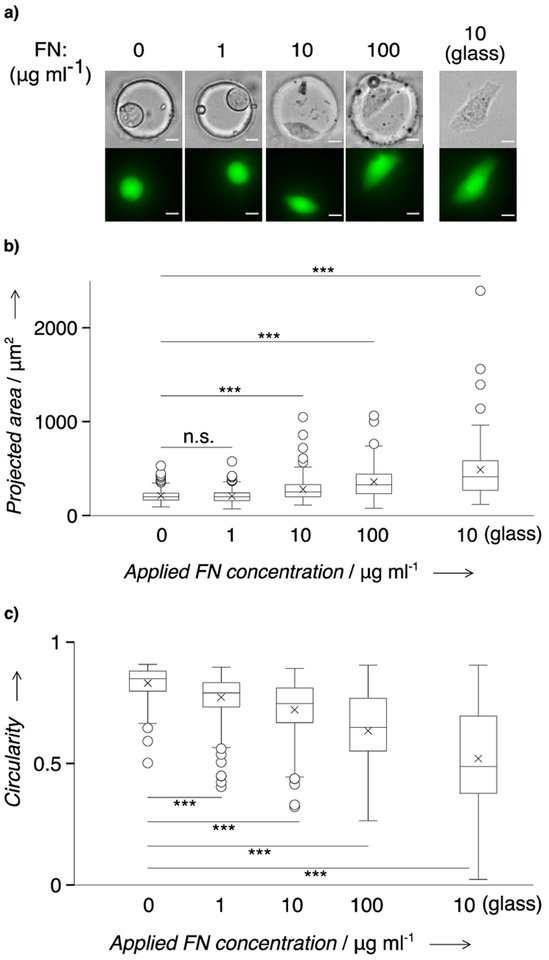
Figure 3.
HeLa cells are viable and spread in FN-coated microwells (50 μm in diameter) on the in situ scWB device. a) Representative micrographs of the overnight cultured HeLa cells in FN-coated microwells molded in PA gel. Top: phase contrast micrographs. Bottom: false-color fluorescence micrographs. Cells were stained with calcein AM for morphology characterization. Scale bar: 10 μm. b) Comparison of the cell projected area on varied applied FN concentrations. c) Comparison of the cell circularity on varied applied FN concentrations. Boxes represent the first and third quartiles of analyte distributions. Black lines indicate the median values. Asterisks mark the mean values. Whiskers are 1.5 fold of interquartile range. Circles are outliers. Mann–Whitney significance levels: n.s., p >0.05; ***, p <0.001. n >75 for each group.

