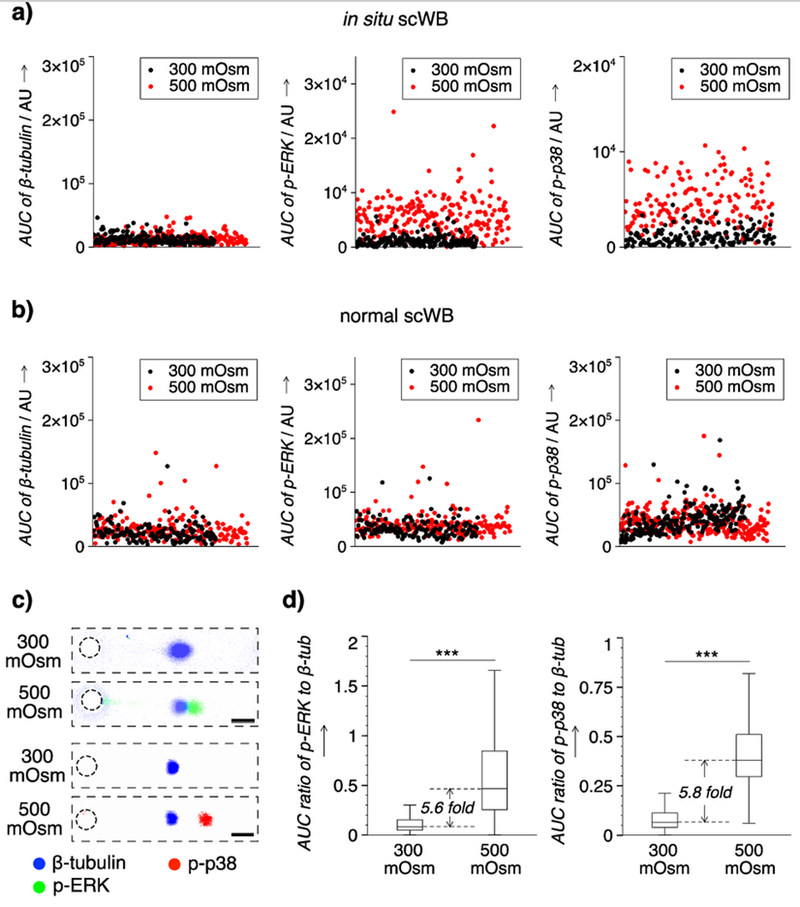
Figure 4.
Phosphorylation of ERK1/2 (ERK) and p38 induced by osmotic stress in single HeLa cells is measured using in situ scWB, but not detected in scWB with ex situ 2D culture, stimulation, and trypsin release to cell suspension. Microwell: 50 μm in diameter. FN concentration: 10 μg ml−1. a) Scatter plots of the protein abundance of single cells from in situ scWB. Insets: zoom-in on y axis. b) Scatter plots of the protein abundance of single cells from scWB of trypsinized cells from conventional 2D cell culture with stimulation (normal scWB). c) Representative false-color fluorescence micrographs of immunoprobed targets in a single cell under iso- and hyper-osmotic conditions. ERK: 42, 44 kDa. Scale bar: 100 μm. d) Box plots that indicate the distribution of the normalized abundance of phosphorylated targets (p-ERK, p-p38) under different osmotic conditions. Boxes represent the first and third quartiles of analyte distributions. Black lines indicate the median values. Whiskers are 1.5 fold of interquartile range. Mann–Whitney significance levels: ***, p <0.001. n >150 for each group.

