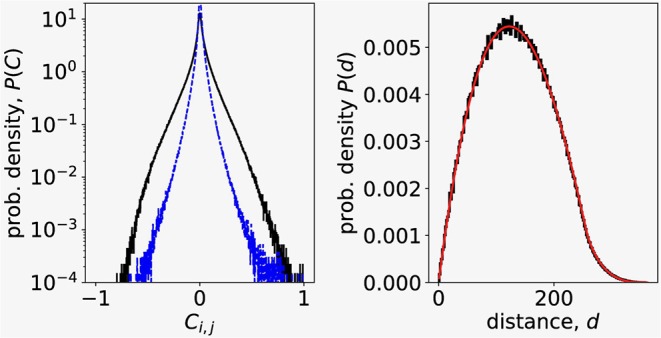
Figure 1.

(Left) Correlation coefficient distribution of N = 4000 Ca2+ signals randomly chosen from experimental dataset (outer, black line). Dashed blue line is the distribution of correlations between residuals after removing the influence of the largest eigenvalue in signals. (Right) Distribution of distances between signals randomly chosen from Ca2+ imaging data. Black line is the experimental data, thinner red line is the theoretical distribution of distances between random points in a square (Philip, 2007).
