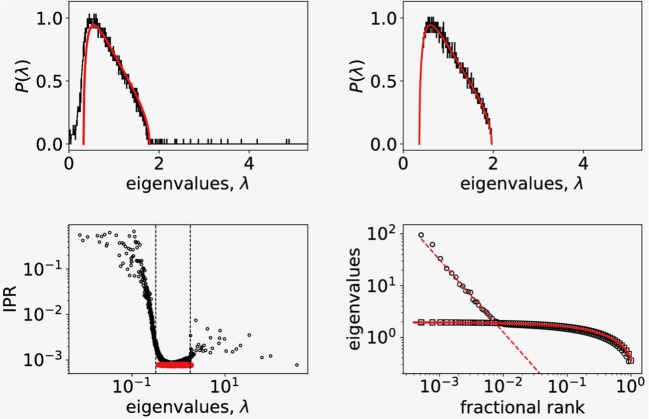
Figure 2.
(Top left) Probability distribution of eigenvalues of the empirical correlation matrix for N = 4,000 randomly picked signals (black solid line) compared to the distribution of eigenvalues of random correlation matrix of the same size (red solid line). (Top right) Probability distribution of eigenvalues of the surrogate correlation matrix constructed from shuffled empirical values (black solid line) compared to the random correlation matrix of the same size (red solid line). (Bottom left) Inverse participation ratio plot of eigenvalues showing a random band matrix structure of C with large IPR values at both edges of the eigenvalue spectrum. The dashed vertical lines show RMT bounds. The IPR spectrum for randomized correlations is shown in red. (Bottom right) The fractional rank plot of the entire spectrum of eigenvalues (open dots). For comparison we added the same plot of eigenvalues of correlation matrix computed from randomized data (open squares). The full line shows the fractional rank plot of eigenvalue spectra obtained from distribution given by Equation (3). The shape of the distribution of large eigenvalues points to a scaling relationship.

