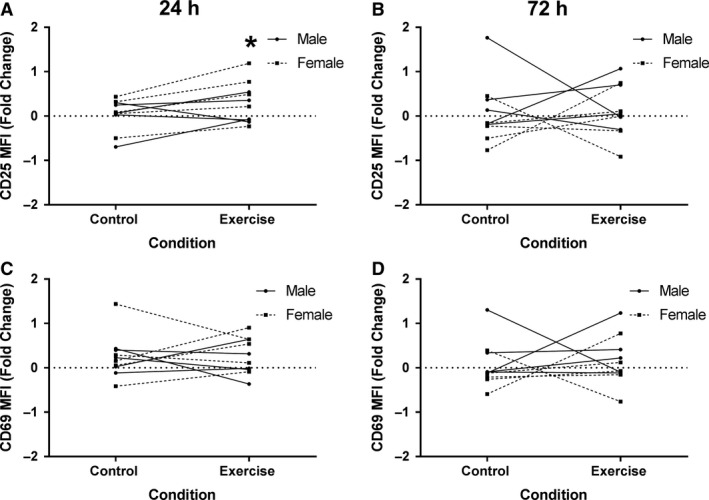
Figure 3.

Expression of surface markers of activation increased on non‐stimulated CD4+ T cell populations. Human CD4+ T cells were isolated and cultured in non‐stimulated wells for 1 and 3 days then stained for CD25 and CD69 and analyzed by flow cytometry. The median fluorescence intensity (MFI) was determined for expression of CD25 at (A) 1 day (Control: 0.03 ± 0.36, Exercise: 0.3 ± 0.46) and at (B) 3 days (Control: 0.07 ± 0.7, Exercise: 0.11 ± 0.59). CD69 expression at (C) 1 days (Control: 0.25 ± 0.49, Exercise: 0.27 ± 0.54) and at (D) 3 days (Control: 0.06 ± 0.52, Exercise: 0.16 ± 0.55). Data are presented as fold change from baseline and visualized as spaghetti plots with each line representing the change between paired samples; n = 10. * Indicates a statistically significant difference (P < 0.05) from the control session.
