
Figure 3.
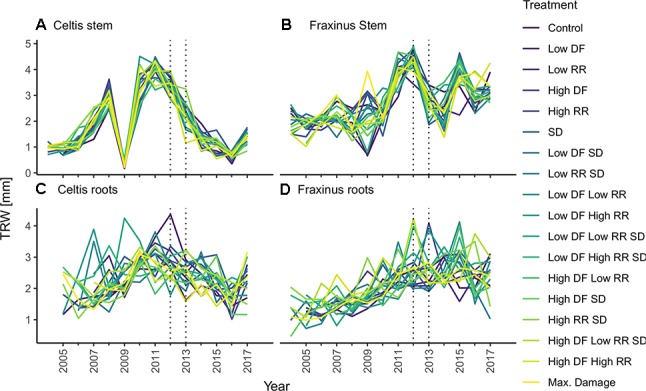
Tree-ring chronologies of (A) Celtis stem growth, (C) Celtis average root growth, and (B) Fraxinus stem growth, and (D) Fraxinus average root growth for each combination of damage treatments. Low growth in 2009 for Celtis and 2009 and 2010 for Fraxinus is related to replanting operations. Damage treatments were applied in 2012–2013 as indicated by the two vertical dotted lines. Damage treatment levels are described as follows: DF, defoliation; RR, root reduction and SD, stem damage indicated as low = 37% damage and high = 75% damage.