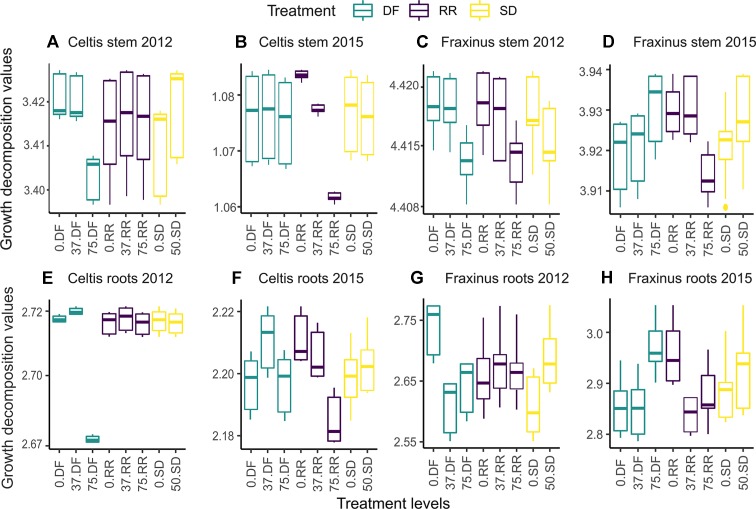
Figure 6.
Partial dependence plots showing tree ring growth decomposition between the different levels of damage treatments obtained by the GBM model for the first year (2012) and last year (2015) following damage treatment. DF, defoliation; RR, root reduction; and SD = stem damage, 0 = null treatment, 37 = low intensity treatment, 75 = high intensity treatment. Panels (A and B) for the stem growth of Celtis, (C and D) for the stem growth of Fraxinus, (E and F) for the root growth of Celtis, and (G and H) for the root growth of Fraxinus. Scales are different in each panel to maximize the visibility of the differences between the treatment levels. The vertical lines represent the “whiskers” for the 5th and 95th percentiles of the data distribution.

