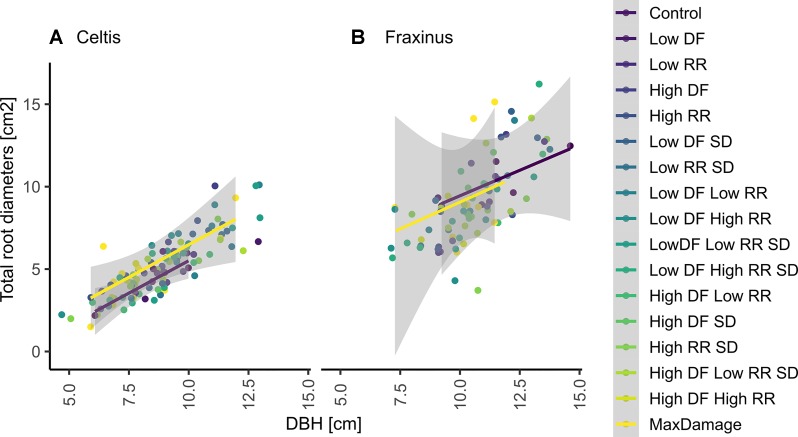
Figure 8.
Correlation between DBH and the sum of all larger root diameters at 20 cm from the stump center in 2017 on (A) Celtis and (B) Fraxinus. The fitted linear model shows a positive linear correlation with the control group (blue line) and with the maximum combination of damage treatment (yellow line) where r2 = 0.7 for Celtis and r2 = 0.5 for Fraxinus, respectively, for both treatments. None of the groups were significantly different for Fraxinus (P > 0.5); similarly, all groups for Celtis were not significantly different, but the “low DF low RR,” which showed a significant reduction in root growth.

