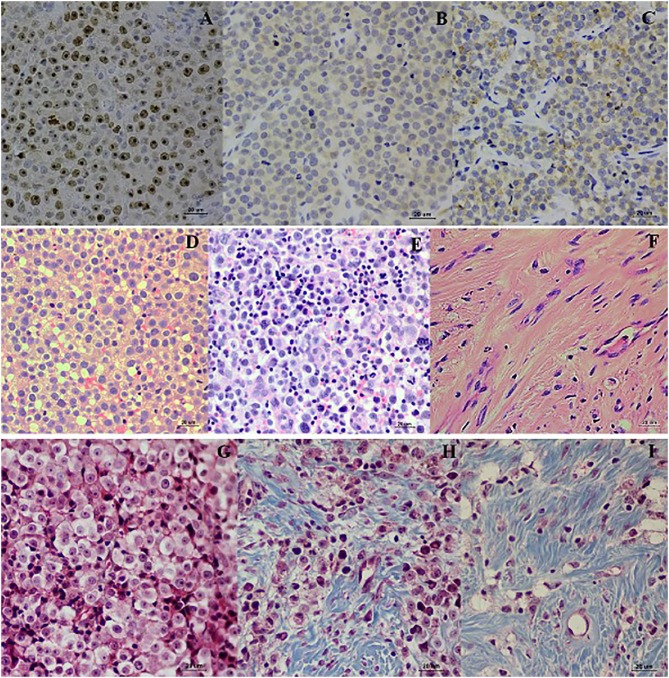
Figure 3.
Localization of Ki-67, Bcl-2, and Bax. Ki-67 localized in the nucleus of TVT cells (A). Bcl-2 localized in nuclear membrane and cytoplasm of CTVT cells (B). Bax localized in the cytoplasm of CTVT cells (C) (LSAB-IHC method, DAB counterstained with Mayer, hematoxylin, bar = 20 μm). Histopathology pictures of CTVT in progression phase and regression phase. CTVT during growth phase (D,G), the section shown the numerous CTVT cells. CTVT during early regression phase (E,H), the section showed the moderate amount of CTVTs and presented the tumor infiltrated lymphocytes (TILs). CTVT during the late stage of regression phase (F,I), fibrous tissue which replaced the CTVT parenchyma (H&E stain, bar = 20 μm) (Masson Trichrome stain, bar = 20 μm).

