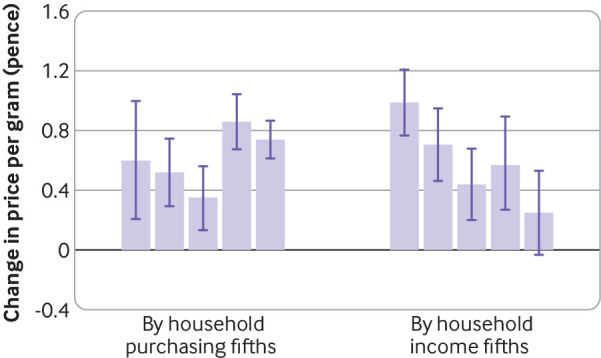
Fig 3.

Coefficients for changes in price per gram of alcohol purchased (main analysis, Scotland minus England), by purchasing fifths (lowest to highest from left to right) and income fifths (lowest to highest from left to right). Whiskers=95% confidence intervals
