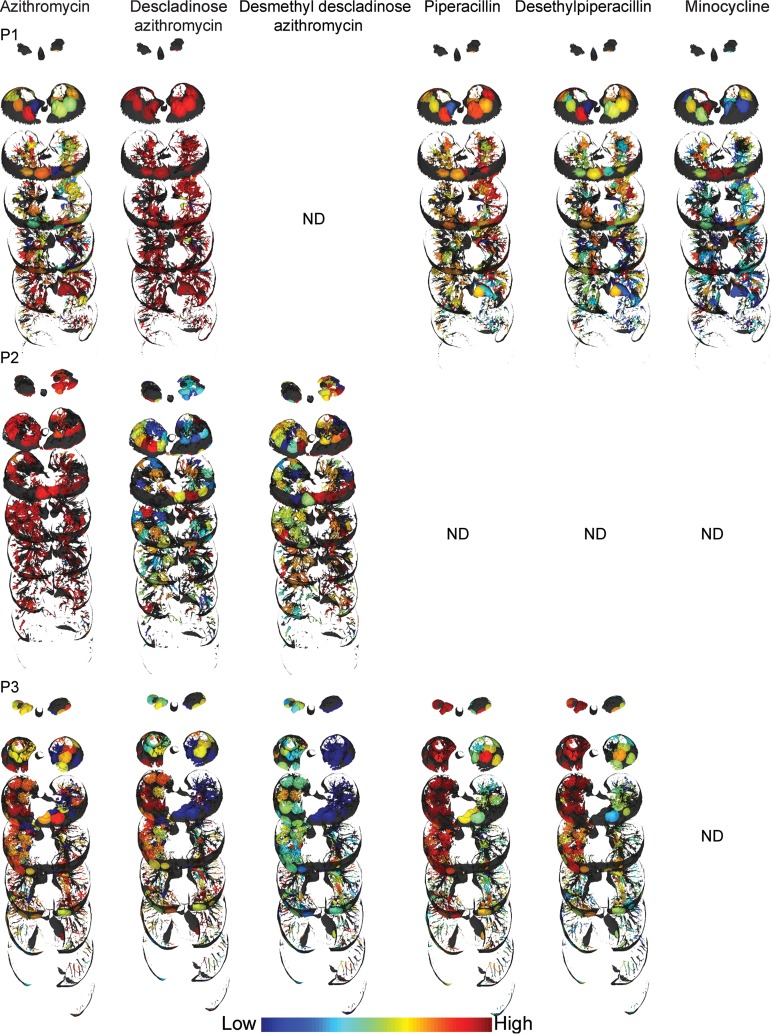
FIG 4.
Distribution of selected antibiotics and the metabolites. P1, patient 1; P2, patient 2; P3, patient 3; ND, not detected. An intensity scale is provided at the bottom (distributions of additional antibiotics and their metabolites are shown in Fig. S5). The relative distributions should be compared within a patient lung. Full visualizations of metabolite maps can be accessed via the following hyperlinks: patient 1, patient 2, and patient 3.

